Decline week 16 — technical rebound to watch
Bayer AG: double bottom near 34, but key resistance is already close
Decline week 16 — technical rebound to watch
In Summary
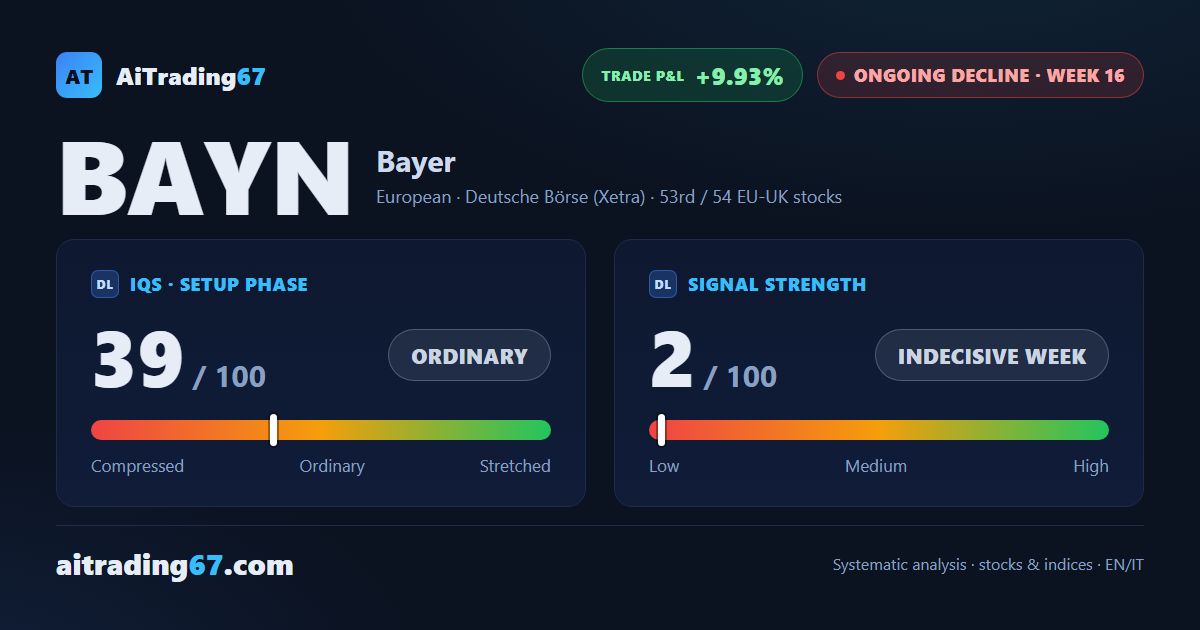
Bayer AG is at week 16 of a sell signal, with a cumulative trade gain of 9.93% since inception. After the late-May capitulation, the last 3 weeks have built a technical rebound off the double bottom near the 34 area — with buyers dominant in volume — but the MACD remains in negative territory and the daily Ichimoku cloud resistance near 38.50 is already within reach. The confirmation week closed bearish: discipline suggests keeping the short position unchanged.
IQS Phase
39
ordinary
Signal Strength
2
indecisive week
Sizing
MINIMUM
Ranking
#53 / 54
EU-UK stocks
Trade P&L %
+9.93%
from signal to today
restricted Platinum content