
Double bottom at 79, but sellers are back
Brunello Cucinelli slips 2.5% but carves a double bottom in the 79 area
Double bottom at 79, but sellers are back
Our view last week
Brunello Cucinelli is in week 12 of a buy signal: the model's coverage is complete, all 3 targets have been hit, and residual capital now carries on with a trailing stop on the Inversion Point. The week just closed was soft, with sellers still outweighing buyers, though some internal signals hint at fading selling pressure.
This week's summary
Brunello Cucinelli's daily chart shows a clean double bottom in the 79 area, with a 9% intermediate rebound. The weekly picture tells a different story: sellers are back in control, above 60% of volume, money flow keeps worsening and the MACD keeps deteriorating. RSI at 44.5, still falling. Price is boxed between the 79.8 and 80.7 areas, below its 200-week average for 19 weeks.
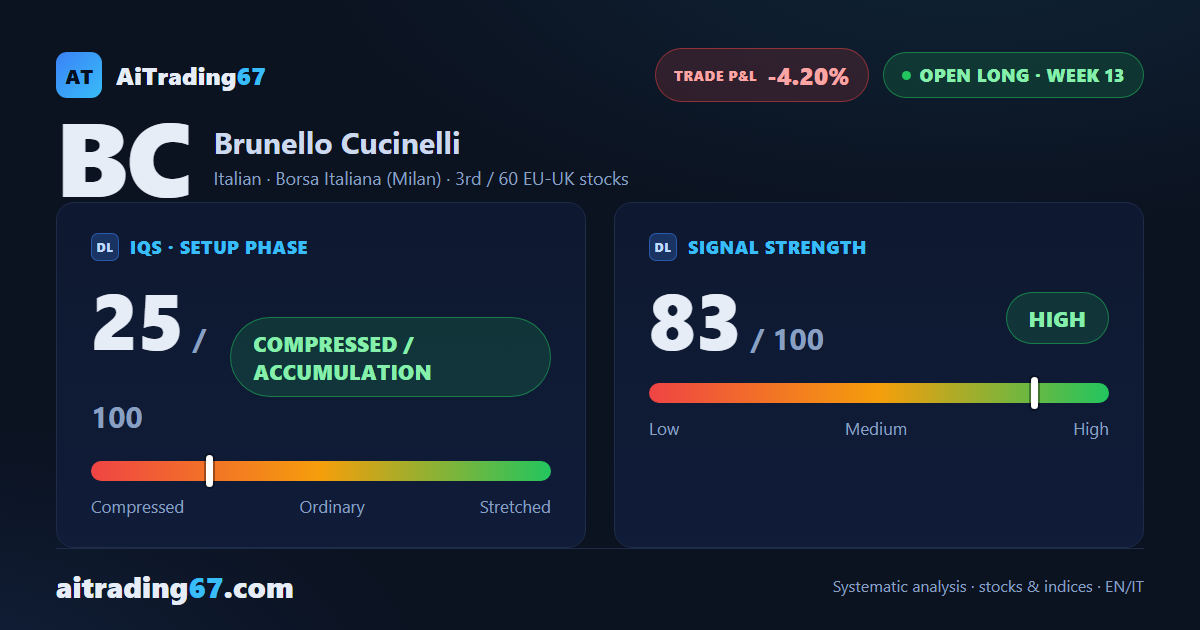
IQS Phase
25
compressed / accumulation
Signal Strength
83
high · wide move
Sizing
FULL
Ranking
#3 / 60
EU-UK stocks in progress
Trade P&L %
-4.20%
from signal to today
restricted Platinum content