EN IT

Bloom Energy: after 3 weeks of correction, the bounce came in hard

At week 23 with the model's coverage complete, Bloom Energy posted a +26.4% week after a 3-week pullback. Residual capital runs at +145% from entry, with a trailing stop on the Inversion Point in the 242 area. Technical analysis of a long trade setup in progress.

Bloom Energy: after 3 weeks of correction, the bounce came in hard
Bloom Energy · week 23 · residual capital running
Bloom Energy: after 3 weeks of correction, the bounce came in hard
June 19, 2026
Bloom Energy · week 23 · residual capital running
In Summary
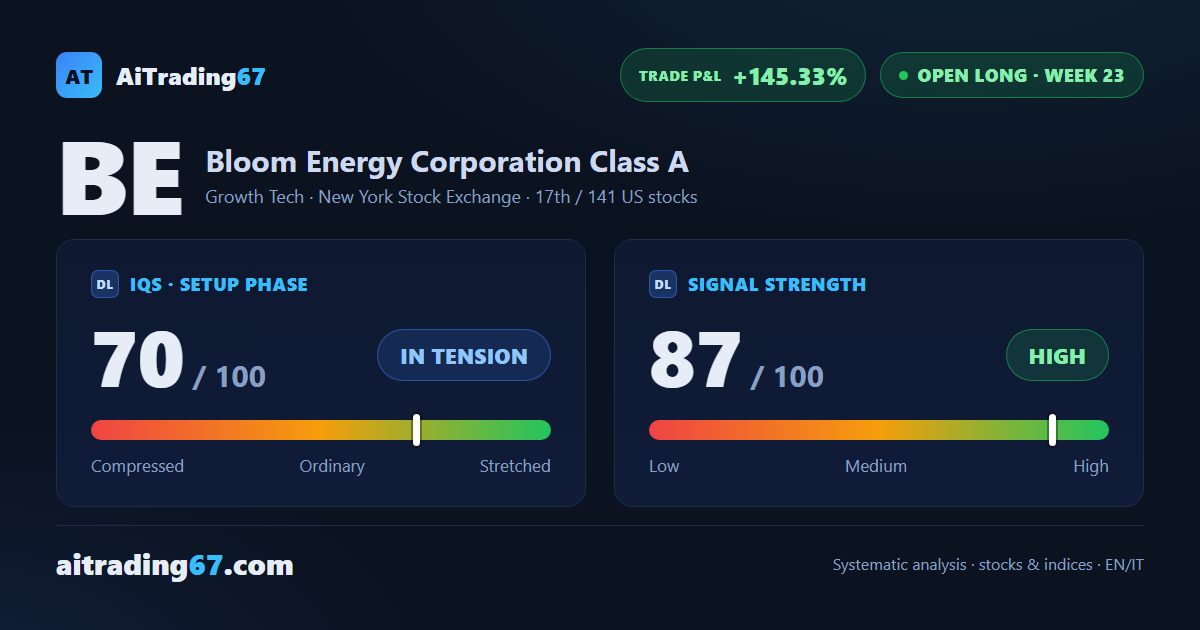
Bloom Energy is at week 23 of a buy signal, with the model's coverage already complete. This week the stock posted +26.4%, returning to cycle highs with buyers at 99%: a decisive rebound after 3 weeks of correction. Residual capital runs at +145% from entry, with the stop trailing the Inversion Point. The short-term technical picture signals renewed traction, but resistance in the 330 area is immediate.
Open long ·23rd week from start ·US stocks ·T1 ★ See Gold version →
IQS Phase
70
in tension
Signal Strength
87
high · wide & volatile
Sizing
FULL
Ranking
#17 / 141
US stocks in progress
Trade P&L %
+145.33%
from signal to today
Chart · Weekly — EMA50 · MACD · VWAP
Weekly chart · EMA50 · MACD · VWAP · Source: TradingView
How to read this pageA visual guide to the post, card by card
The full analysis, operating plan and detailed levels on this asset are reserved for clients ★ PLATINUM
restricted Platinum content
Share WhatsApp Telegram Gmail LinkedIn