
Bloom Energy: the rally cools, a double bottom emerges
Bloom Energy drops 9.7%, but holds at the double bottom in the 230 area
Bloom Energy: the rally cools, a double bottom emerges
Our view last week
Bloom Energy is in week 25 of a buy trade whose model coverage is complete: all 3 statistical targets have been hit, and the residual capital, now 100% of the position still alive, is running at +102% since entry. The stop is trailing the weekly Inversion Point, in the 242 area. On the technical side, though, the week just closed shows signs of cooling after mid-June's acceleration.
This week's summary
Bloom Energy shares dropped 9.7% this week: a plunge to the 230 area met a double bottom and a 53% rebound, while money flow keeps worsening and the weekly MACD has just crossed bearish. This week's technical analysis confirms the cooling flagged seven days ago: price is back against support in the 242 area. The trade is still up 82% from entry.
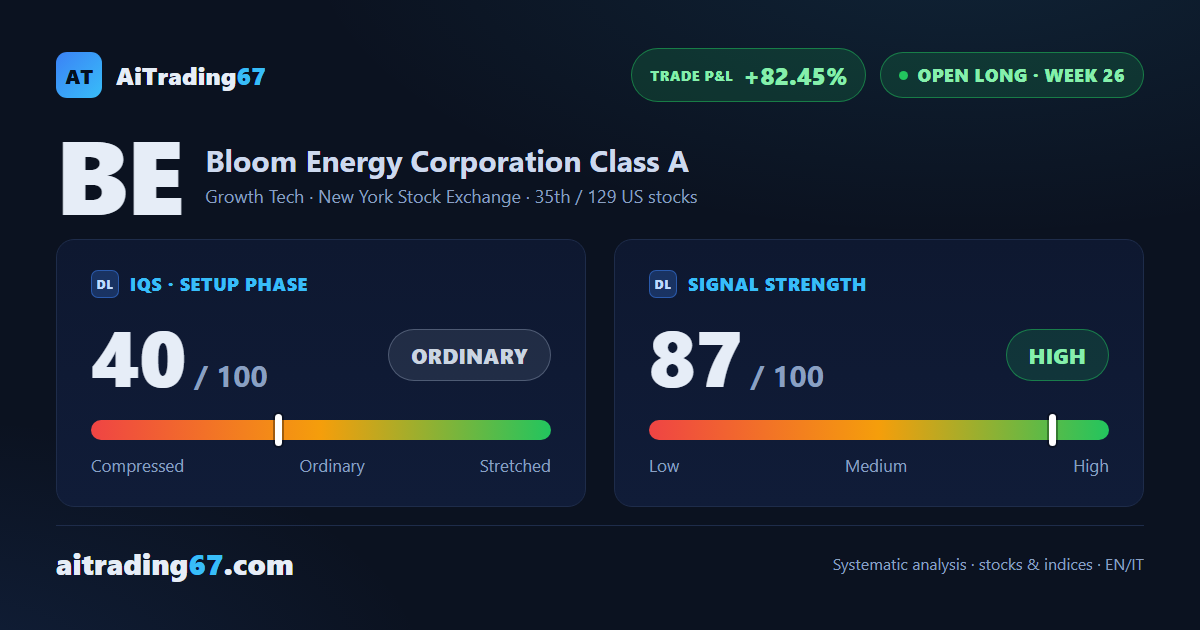
IQS Phase
40
ordinary
Signal Strength
87
high · wide & volatile
Sizing
FULL
Ranking
#35 / 129
US stocks in progress
Trade P&L %
+82.45%
from signal to today
restricted Platinum content