
Decline cools as price nears the Inversion Point
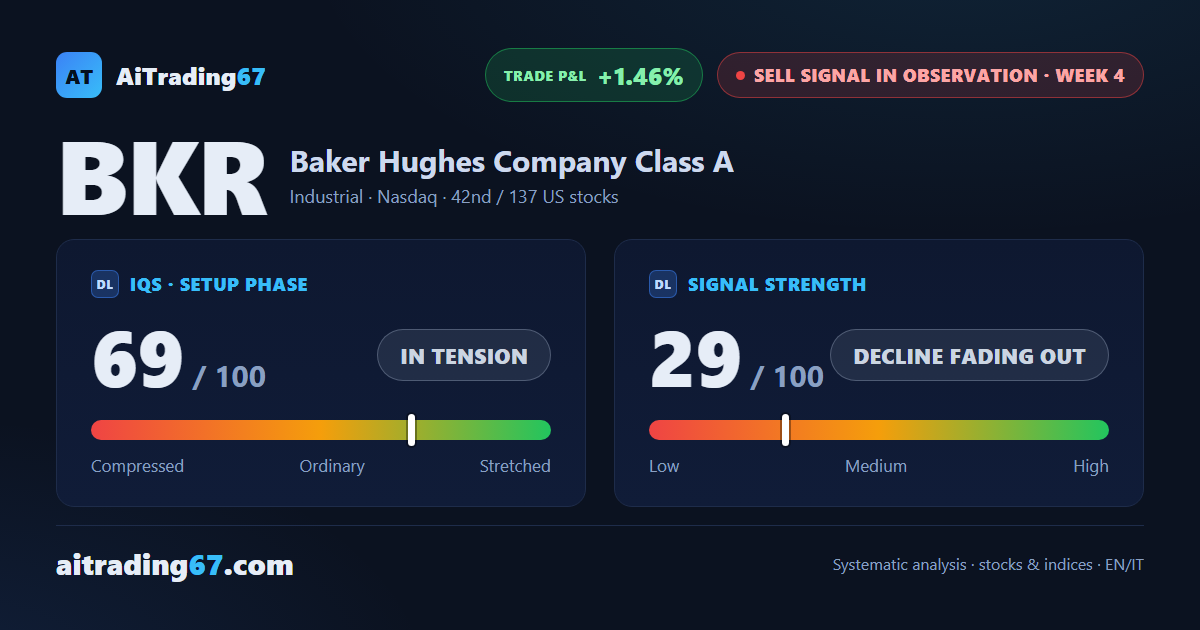
Baker Hughes shares jump 9.1% as the sell signal starts fading out
Decline cools as price nears the Inversion Point
Our view last week
Baker Hughes is in week 3 of a sell signal, ranking 18th among the 137 US sell signals. The week closed down 6.7% as the decline extends with lower lows: signal strength climbs to 54 out of 100. The stock still trades 25.6% above its 200-week average, a condition our model flags as not recommended for a new short.
This week's summary
Baker Hughes stock jumps 9.1% this week, the sharpest bounce since its sell signal began: price is back within a step of the Inversion Point, in the 59.7 area. In this week's technical analysis, signal strength — which was climbing on lower lows last week — is now giving ground, a decline running out of steam. The signal has slipped from 18th to 42nd among the 137 US sell signals.
Sell signal in observation
·4th week from start
·US stocks
·T2
·📅 Earnings · Jul 26
★ See Gold version →
IQS Phase
69
in tension
Signal Strength
29
decline fading out
Sizing
MINIMUM
Ranking
#42 / 137
US stocks sell signals
Trade P&L %
+1.46%
from signal to today
restricted Platinum content