
Sell signal, week 4 · US stocks
BlackRock slips 2.5% as the weekly MACD drops below its Signal line after 11 weeks
Our view last week
BlackRock bounced 1.5% in a week when the financial sector slid 1.8%, and for a 2nd week running volume sits with the buyers. The Sell signal, already slowing seven days ago, has now lost almost all of its push: strength drops from 27 to 3 out of 100. The price action in BlackRock stock shows price wedged between two moving averages, with October 9 earnings close at hand. One of the US stocks to watch.
This week's summary
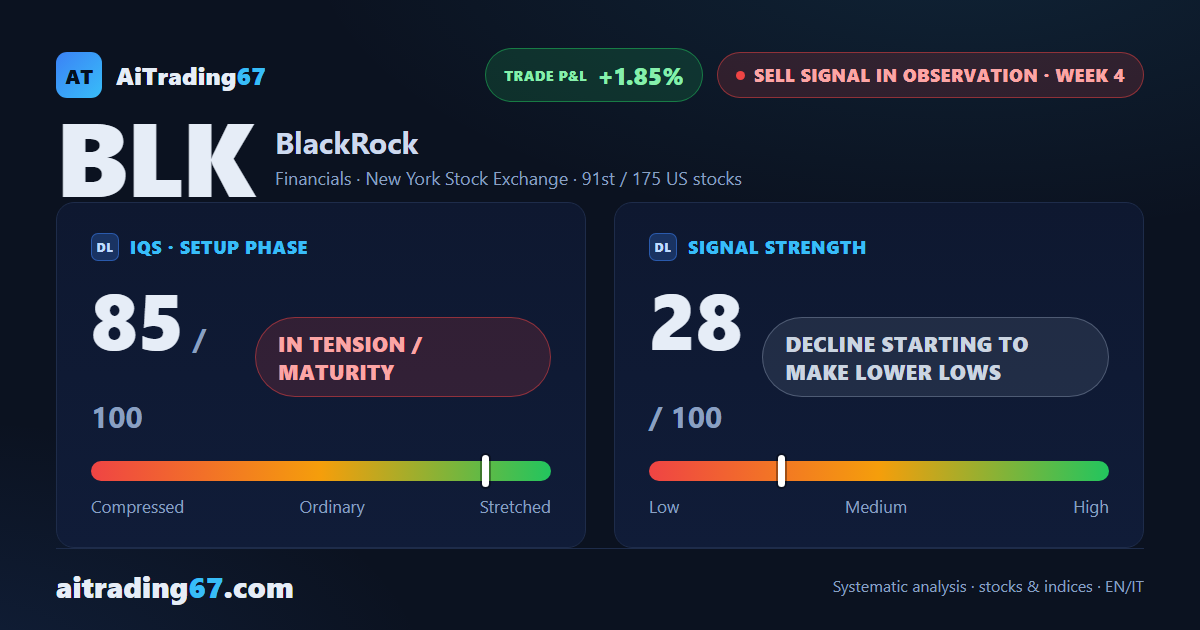
BlackRock slipped 2.5% and fell back under its 50-week average, while the weekly MACD dropped below its Signal line after 11 weeks above it. A week ago a bounce seemed to have switched the Sell signal off; now BlackRock stock is tracking the weakness of the financial sector and the decline is picking up pace again. Daily price action ends with a bearish engulfing. The signal is still unconfirmed, though, and October 14 earnings are close. One of the US stocks to watch.
Sell signal in observation
·4th week from start
·US stocks
·T2
·📅 Earnings · Oct 14
★ See Gold version →
IQS Phase
85
in tension / maturity
Signal Strength
28
decline starting to make lower lows
Sizing
MINIMUM
Ranking
#91 / 175
US stocks sell signals
Trade P&L %
+1.85%
from signal to date, no stop loss
BlackRock (BLK) weekly chart — EMA50 · MACD · VWAP
Weekly chart · EMA50 · MACD · VWAP · Source: TradingView
Rank position
ranks 91st among the 175 sell signals for US stocks in our ranking, with a signal strength of 28 out of 100.
Sector context
SectorFinancials
Benchmark ETFXLF
Sector regimeweak phase
Performanceweekly -2.46% · monthly -7.23%
BLK belongs to the financials sector (reference ETF XLF). The sector is classified weak phase according to our weekly reading.
restricted Platinum content