Sell signal · week 2 · trading not recommended
BlackRock: sell signal under observation as price moves against the trend
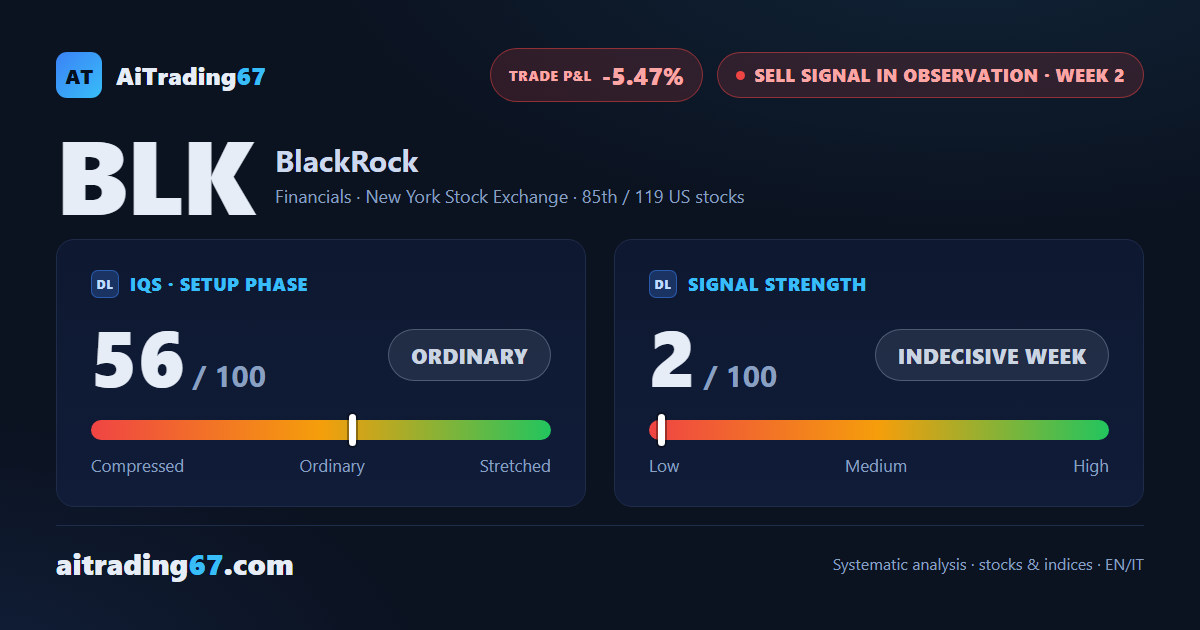
Sell signal · week 2 · trading not recommended
In Summary
BlackRock is in week 2 of a sell signal, with a notable contradiction: price is building higher lows on the daily chart while the weekly structure remains bearish. Trading is not recommended per our model, and the stock ranks 85th among 119 US sell signals. Maximum caution is warranted before any move.
IQS Phase
56
ordinary
Signal Strength
2
indecisive week
Sizing
MINIMUM
Ranking
#85 / 119
US stocks sell signals
Trade P&L %
-5.47%
from signal to today
restricted Platinum content