
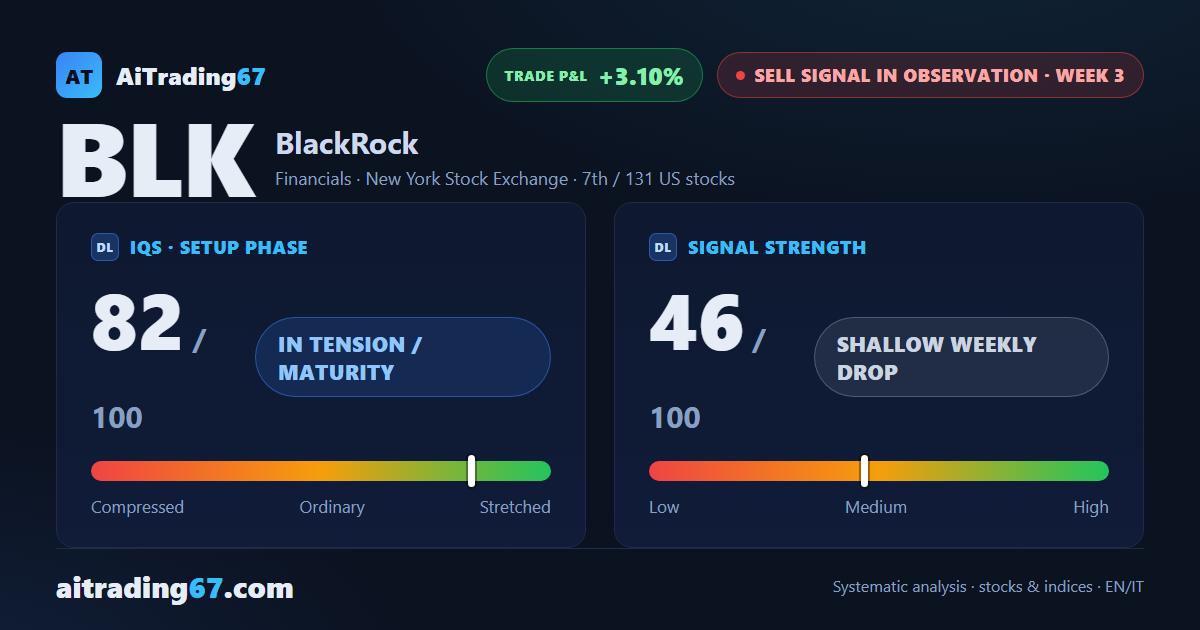
Sell signal under observation — week 3
BlackRock: three weeks sideways and a double bottom that matters
Sell signal under observation — week 3
In Summary
BlackRock is in week 3 of a sell signal, and for the 3rd consecutive time the market closed sideways — leaving the signal unconfirmed. On the daily chart, a double bottom is forming in the 973 area with a 12% intermediate rebound, a contrarian element that adds weight to the picture. Our model flags elevated-risk conditions for new trades, and opening a new short position remains high-risk at this stage.
IQS Phase
82
in tension / maturity
Signal Strength
46
shallow weekly drop
Sizing
REDUCED
Ranking
#7 / 131
US stocks sell signals
Trade P&L %
+3.10%
from signal to today
restricted Platinum content