
The decline slows, but sellers aren't done yet
BlackRock rises 4.1% for a second week, but sellers keep control
The decline slows, but sellers aren't done yet
Our view last week
BlackRock is in week 5 of a sell signal, and this week the price recovered 3.2% with buyers at 88% of volume, after the prior week's 8.1% drop dominated by sellers. The picture stays mixed: momentum worsened sharply and distribution hasn't fully cleared. The stock, listed on the New York Stock Exchange, ranks 57th among the 137 US sell signals.
This week's summary
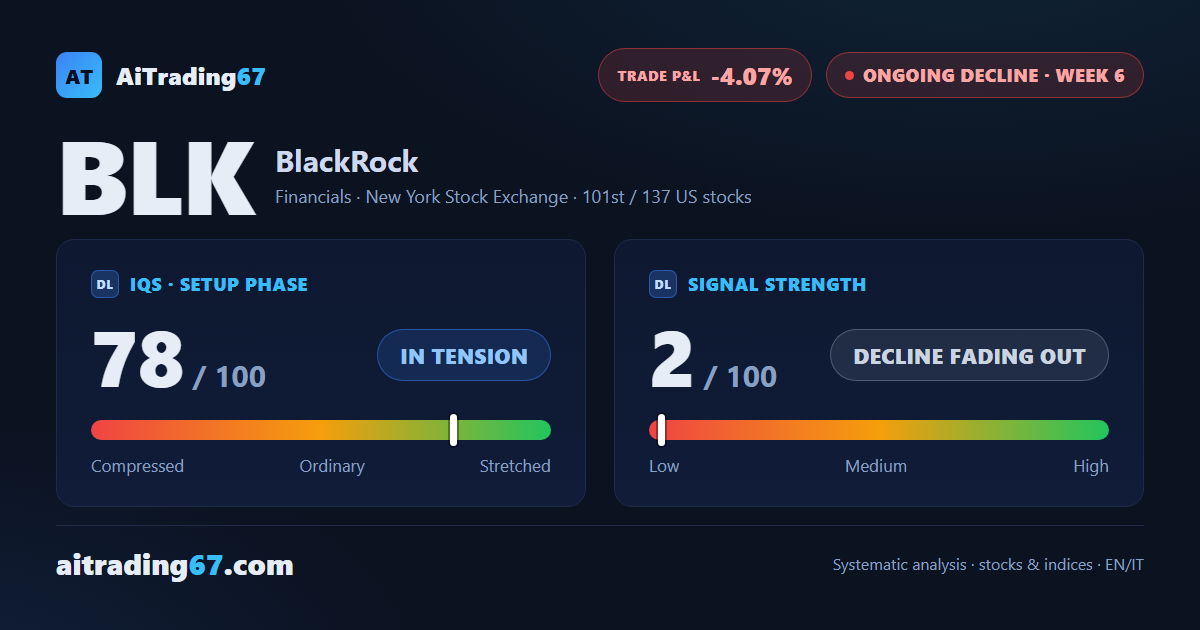
BlackRock closed the week up 4.1%, the second straight gain after a sharp 8.1% drop two weeks ago: buyers ran over 80% of turnover and the stock is back near its 50-week average. On the daily chart, though, sellers still hold the upper hand and the distribution phase hasn't cleared: the short open on the sell signal has slipped back into a 4% loss.
IQS Phase
78
in tension
Signal Strength
2
decline fading out
Sizing
MINIMUM
Ranking
#101 / 137
US stocks
Trade P&L %
-4.07%
from signal to today
restricted Platinum content