
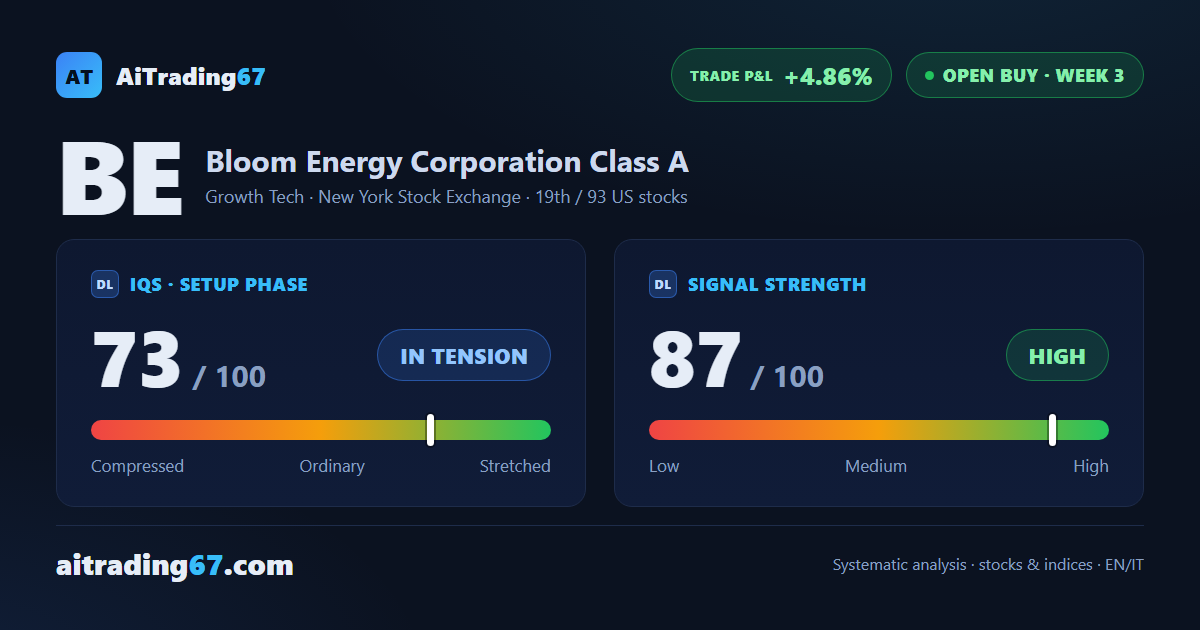
Open BUY · week 3 · early-exit warning
Bloom Energy ends the week up 0.2%: a new 30-day high the close did not confirm
Our view last week
Bloom Energy stock rebounds 8.7% after last week's dip, and this time the tape is behind it: in the last session 86% of volume was on the buy side, against 3% a week earlier. The weekly MACD is back above its signal line after 11 weeks, and weekly money flow has turned positive. The buy signal holds, but with an early-exit warning: price is pressing just under the 7-day high, in the 293 area, which has yet to be cleared.
This week's summary
A new 30-day high in the 302 area, yet the weekly close failed to confirm it: the week ends up 0.2% on an indecisive candle. A week ago Bloom Energy stock was pressing under the 293 area; it has now pushed through without managing to hold above. On the weekly technical analysis the MACD stays above its signal line while the ADX keeps falling. The buy signal holds, with the early-exit warning still standing: among US stocks with weekly buy signals, a swing trading setup that demands discipline.
IQS Phase
73
in tension
Signal Strength
87
high · wide & volatile
Sizing
FULL
Ranking
#19 / 93
US stocks in progress
Trade P&L %
+4.86%
from signal to date, no stop loss
Bloom Energy (BE) weekly chart — EMA50 · MACD · VWAP
Weekly chart · EMA50 · MACD · VWAP · Source: TradingView
Rank position
ranks 19th among the 93 Longs already running for US stocks in our ranking, with a signal strength of 87 out of 100.
Sector context
SectorGrowth Tech
Benchmark ETFXLK
Sector regimein strong phase
Performanceweekly +1.80% · monthly +8.83%
BE belongs to the growth tech sector (reference ETF XLK). The sector is classified in strong phase according to our weekly reading.
restricted Platinum content