
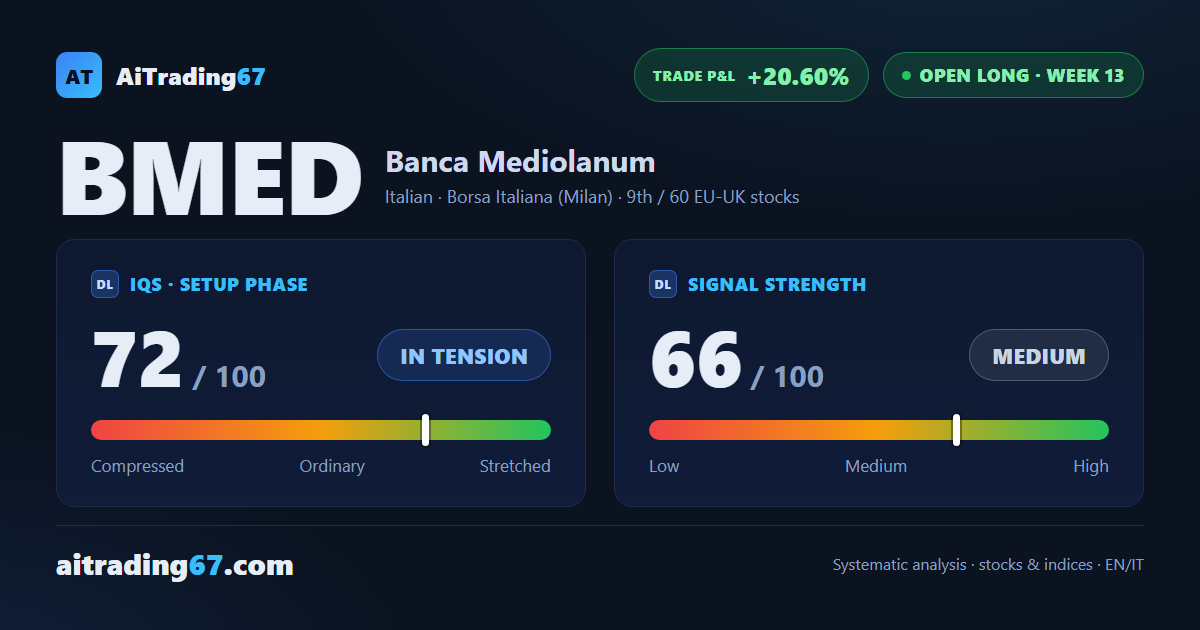
Trade under management, week 13 · +20.6%
Banca Mediolanum slips 1.1%: first cracks appear after the rally
Trade under management, week 13 · +20.6%
Our view last week
Banca Mediolanum is in week 12 of a buy signal that has exhausted the model's coverage: all 3 statistical targets have been hit and the stop now follows the Inversion Point, in the 20.8 area. The trade is running at +21.90% from entry. On the technical side, the week closed up 4.6%, with buy volume at 99%, while price stays compressed between the first resistance and the first support.
This week's summary
Banca Mediolanum eases off after last week's 4.6% jump: this week it slips 1.1%, with volume contracting and the last candle's body losing conviction, the first signs of fatigue after a long run. Price still sits boxed between the first resistance, in the 22.6 area, and the first support, in the 22.3 area, just off its all-time highs, while a rising ADX says the uptrend structure still holds. The trade is running at +20.6% from entry.
IQS Phase
72
in tension
Signal Strength
66
medium
Sizing
STANDARD
Ranking
#9 / 60
EU-UK stocks in progress
Trade P&L %
+20.60%
from signal to today
restricted Platinum content