
Sell signal, week 6: the decline picks up speed
BNP Paribas drops 7.3% and loses its 50-week average as money flow turns negative
Our view last week
On the daily chart BNP Paribas stock has printed 4 lower highs since September 4, from the 105 area down to the 103 area, and the week closed 1.4% lower, a third straight loss. The band of levels between the 101 and 103 areas turned the bounce back again, the MACD stays below its Signal line and momentum has flipped negative. In this technical analysis the price action trading picture still backs the sell signal, with the short 3.2% in profit.
This week's summary
BNP Paribas stock lost 7.3%, its fourth straight weekly decline, and slipped below both its 50-week and 200-day moving averages. A week ago the bounce had stalled under the band of levels between the 101 and 103 areas; now money flow turns negative after 18 weeks and the price action prints a new 90-day low, not confirmed on the close. In this technical analysis the counterweight is short-term: a daily RSI at 25, in oversold territory.
IQS Phase
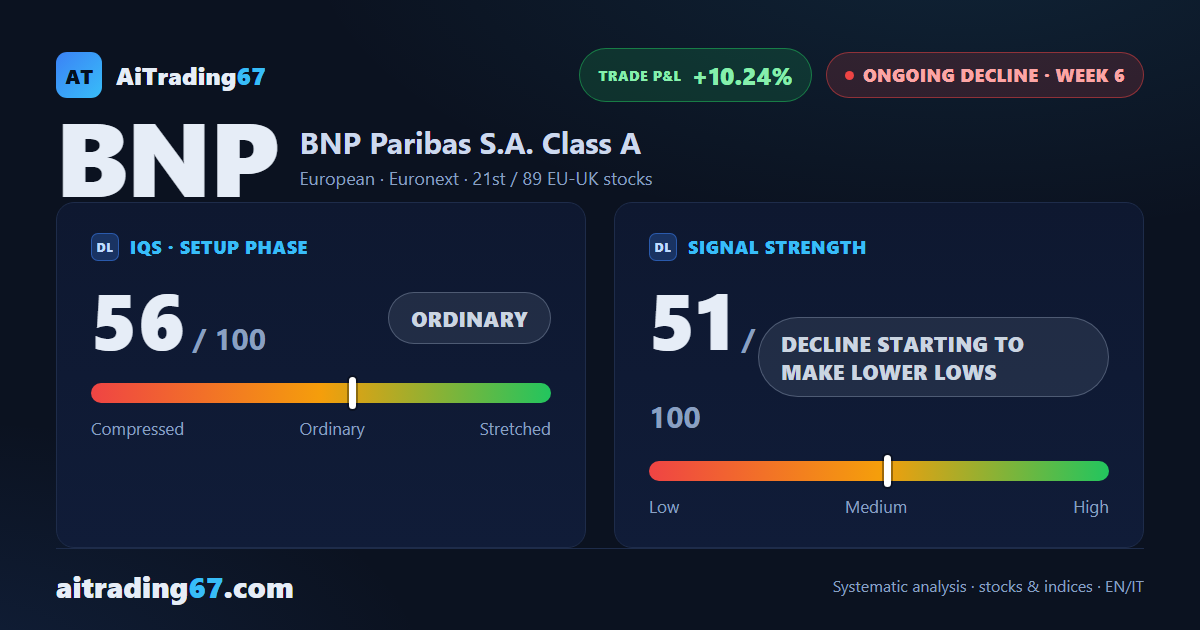
56
ordinary
Signal Strength
51
decline starting to make lower lows
Sizing
STANDARD
Ranking
#21 / 89
EU-UK stocks
Trade P&L %
+10.24%
from signal to date, no stop loss
BNP Paribas weekly chart — EMA50 · MACD · VWAP
Weekly chart · EMA50 · MACD · VWAP · Source: TradingView
Rank position
ranks 21st among the 89 sell signals for European-UK stocks in our ranking, with a signal strength of 51 out of 100.
Sector context
SectorEuropean
Benchmark ETFEXV1
Sector regimeweak phase
Performanceweekly -4.91% · monthly -4.92%
BNP belongs to the european sector (reference ETF EXV1). The sector is classified weak phase according to our weekly reading.
restricted Platinum content