
US stocks · Sell signal in week 6
Boeing slips 2.3% to a fresh 30-week low that the weekly close fails to confirm
Our view last week
After last week's 5.8% drop, Boeing stock is braking: it closed at -0.1%, and a midweek climb died against the moving-average cluster in the 203-205 area. The daily chart shows three lower highs, from the 215 area to the 204 area. Price action still points to distribution, with sellers at 62% of volume, down from 84% a week ago. Among US stocks on our radar the sell signal holds, and the short is 5.6% in profit.
This week's summary
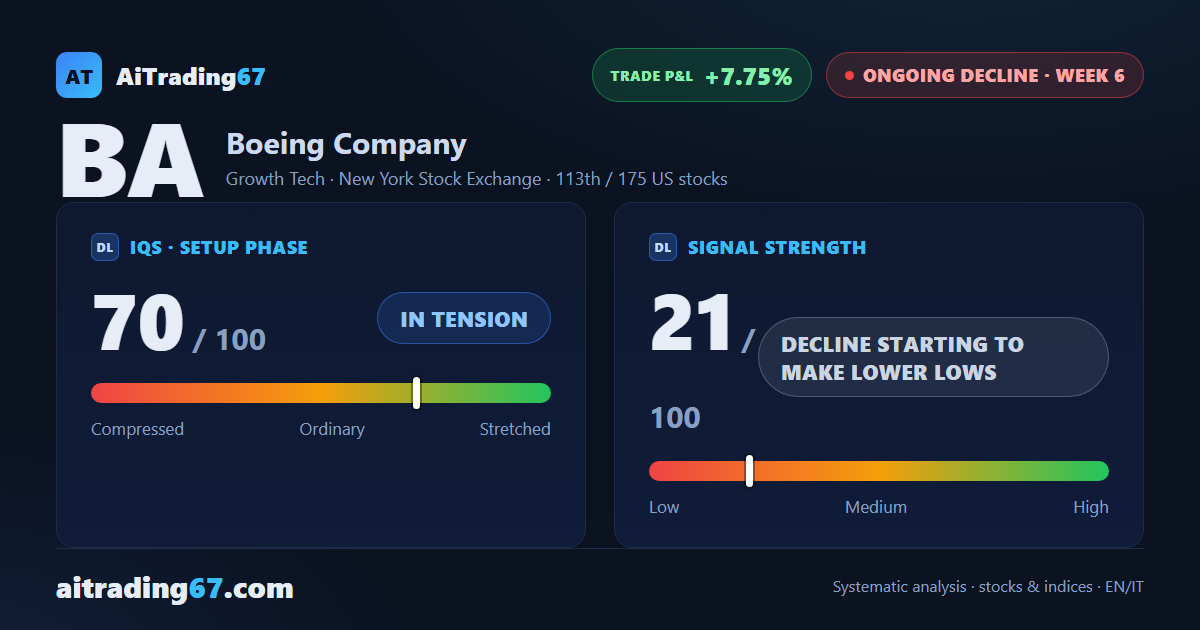
Boeing drops 2.3%, its 4th straight weekly decline, and prints a fresh 30-week low in the 184 area. The close does not confirm it, though: the week finishes in the upper part of its range. A week ago Boeing stock had stalled against its moving averages; now price action turns lower again, with 4 lower highs on the daily chart and the MACD falling for 7 weeks. Among US stocks the sell signal holds, and the short is more than 7.7% in profit.
IQS Phase
70
in tension
Signal Strength
21
decline starting to make lower lows
Sizing
MINIMUM
Ranking
#113 / 175
US stocks
Trade P&L %
+7.75%
from signal to date, no stop loss
Boeing (BA) weekly chart — EMA50 · MACD · VWAP
Weekly chart · EMA50 · MACD · VWAP · Source: TradingView
Rank position
ranks 113th among the 175 sell signals for US stocks in our ranking, with a signal strength of 21 out of 100.
Sector context
SectorGrowth Tech
Benchmark ETFXLK
Sector regimein strong phase
Performanceweekly +1.80% · monthly +8.83%
BA belongs to the growth tech sector (reference ETF XLK). The sector is classified in strong phase according to our weekly reading.
restricted Platinum content