
Weekly dip, but the lows keep climbing
Berkshire Hathaway drops 2.8%, but the stop already sits at breakeven
Weekly dip, but the lows keep climbing
Our view last week
Berkshire Hathaway is in week 2 of a buy signal: the confirmation week closed bullish, and discipline suggests keeping the position unchanged. The gain since entry already stands at 3.74%, but signal strength stays low, at 27 out of 100, and fading. The stock ranks 115th among the 125 US stock buys currently open.
This week's summary
Berkshire Hathaway shares close the week down 2.8%, but the daily price action tells a different story: higher lows running from the 486 area to the 495 area — a swing trading detail that softens the red weekly candle. The buy signal is in week 3, the stop has already moved to breakeven, and the Financial sector still runs strong.
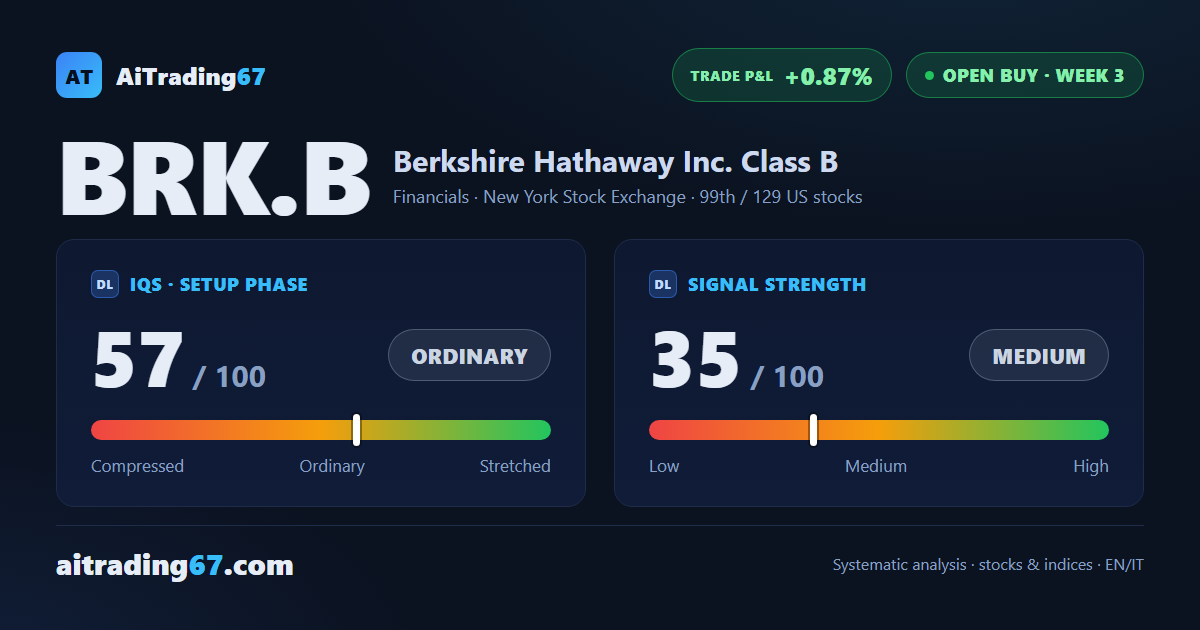
IQS Phase
57
ordinary
Signal Strength
35
medium · weak
Sizing
REDUCED
Ranking
#99 / 129
US stocks in progress
Trade P&L %
+0.87%
from signal to today
restricted Platinum content