
Berkshire Hathaway stock, 6th week of a steady buy
Berkshire Hathaway stock climbs 3.4% heading into earnings
Berkshire Hathaway stock, 6th week of a steady buy
Our view last week
Berkshire Hathaway shares close the week up a modest 0.8%, but the daily chart carves a fresh double bottom in the 483 area, with a 4% rebound holding the structure together. Price is now pressing against the daily Bollinger Band midline, in the 495.7 area, while recent highs remain a heavily contested level. Our technical analysis shows the buy signal, now in its 5th week, is still open but signal strength has slipped to 35 out of 100, with earnings approaching on August 3.
This week's summary
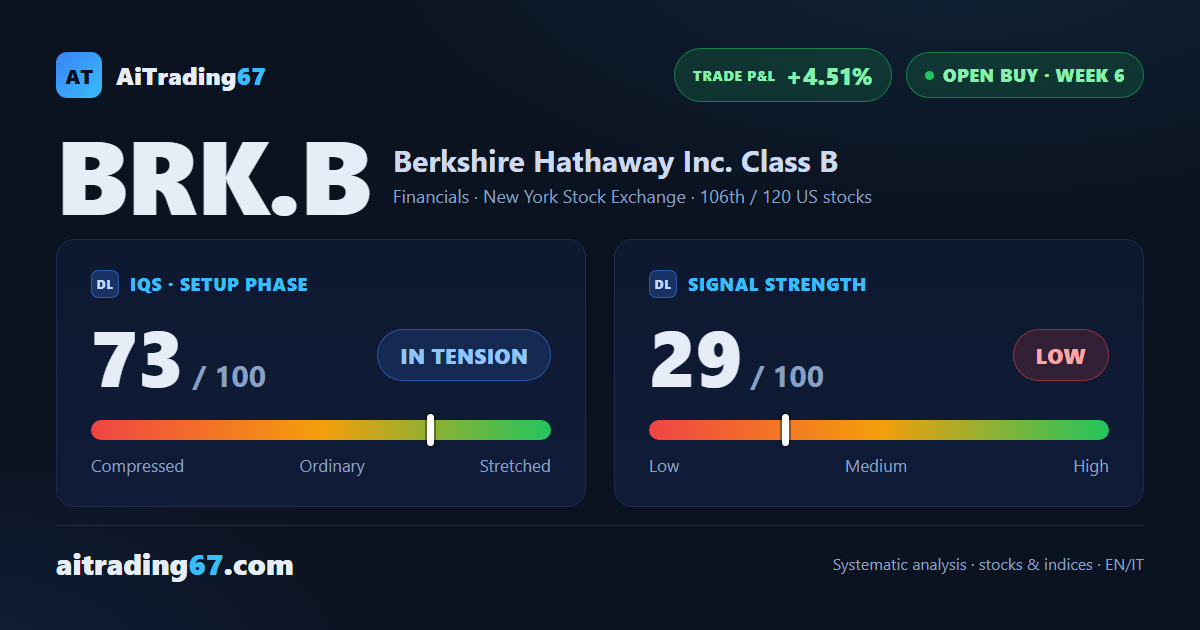
Berkshire Hathaway stock bounces 3.4% off its 20-day moving average, with 76% of trading volume on the buy side backing the move. Our weekly technical analysis confirms the buy signal, now in its 6th week and up 4.5% since entry. The stock is still hugging its all-time highs, a level already tested several times, while Q2 earnings land on Wednesday, August 3.
IQS Phase
73
in tension
Signal Strength
29
low · fading
Sizing
MINIMUM
Ranking
#106 / 120
US stocks in progress
Trade P&L %
+4.51%
from signal to date, no stop loss
Rank position
ranks 106th among the 120 Longs already running for US stocks in our ranking, with a signal strength of 29 out of 100.
Sector context
SectorFinancials
Benchmark ETFXLF
Sector regimein strong phase
Performanceweekly +1.12% · monthly +3.94%
BRK.B belongs to the financials sector (reference ETF XLF). The sector is classified in strong phase according to our weekly reading.
restricted Platinum content