
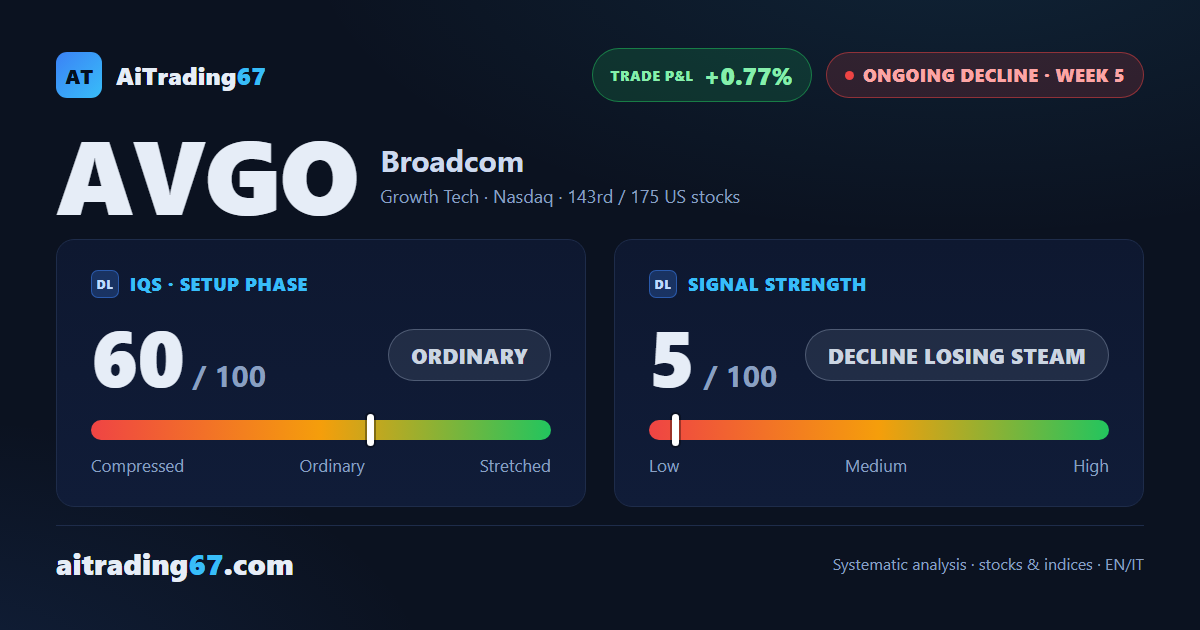
Ongoing decline, week 5: lower highs still in place
Broadcom adds 0.7% but its 50-week average, tested, turns the price back
Our view last week
Broadcom closed the week at -1.3% and slipped just below its 50-week average, the level it was still resting on seven days ago, while the US tech sector gained 3.5%. On the daily chart the run of 3 lower highs, from the 373 area to the 367 area, is still intact. For Broadcom stock the sell signal is moving at a slow pace and price action stays indecisive: our technical analysis calls for caution before any new trade.
This week's summary
Broadcom gained 0.7% after 2 down weeks, but the recovery stalled at the 50-week average: touched, then closed back below. On the daily chart the lower highs are now 4, from the 373 area to the 362 area, while US tech stocks keep climbing. For Broadcom stock price action stays indecisive: weekly money flow has turned positive, the daily reading is still negative. Our technical analysis sees a sell signal that still lacks follow-through, one to track with a swing trading mindset.
IQS Phase
60
ordinary
Signal Strength
5
decline losing steam
Sizing
MINIMUM
Ranking
#143 / 175
US stocks
Trade P&L %
+0.77%
from signal to date, no stop loss
Broadcom (AVGO) weekly chart — EMA50 · MACD · VWAP
Weekly chart · EMA50 · MACD · VWAP · Source: TradingView
Rank position
ranks 143rd among the 175 sell signals for US stocks in our ranking, with a signal strength of 5 out of 100.
Sector context
SectorGrowth Tech
Benchmark ETFXLK
Sector regimein strong phase
Performanceweekly +1.80% · monthly +8.83%
AVGO belongs to the growth tech sector (reference ETF XLK). The sector is classified in strong phase according to our weekly reading.
restricted Platinum content