
Sell signal · week 20
Buzzi gains 1.8% and breaks its run of lower highs on the daily chart
Our view last week
After a week with 93% of volume on the sell side, buyers are back on Buzzi: 74% of the trading went to the buy side. Price didn't follow, though, slipping 0.3% for a fourth straight down week, with daily highs getting lower. For Buzzi stock the technical analysis stays bearish, and the short in this swing trading setup is up 15%.
This week's summary
Buzzi has broken its run of lower highs on the daily chart: after 4 straight down weeks the stock gained 1.8%, and one close cleared the last high, in the 38 area. The bounce stalled at the 200-week moving average, lost in September, and money flow is still negative, though improving. For Buzzi stock the technical analysis stays bearish, and the price action says only that the slide has slowed; the short in this swing trading setup is up 13%.
IQS Phase
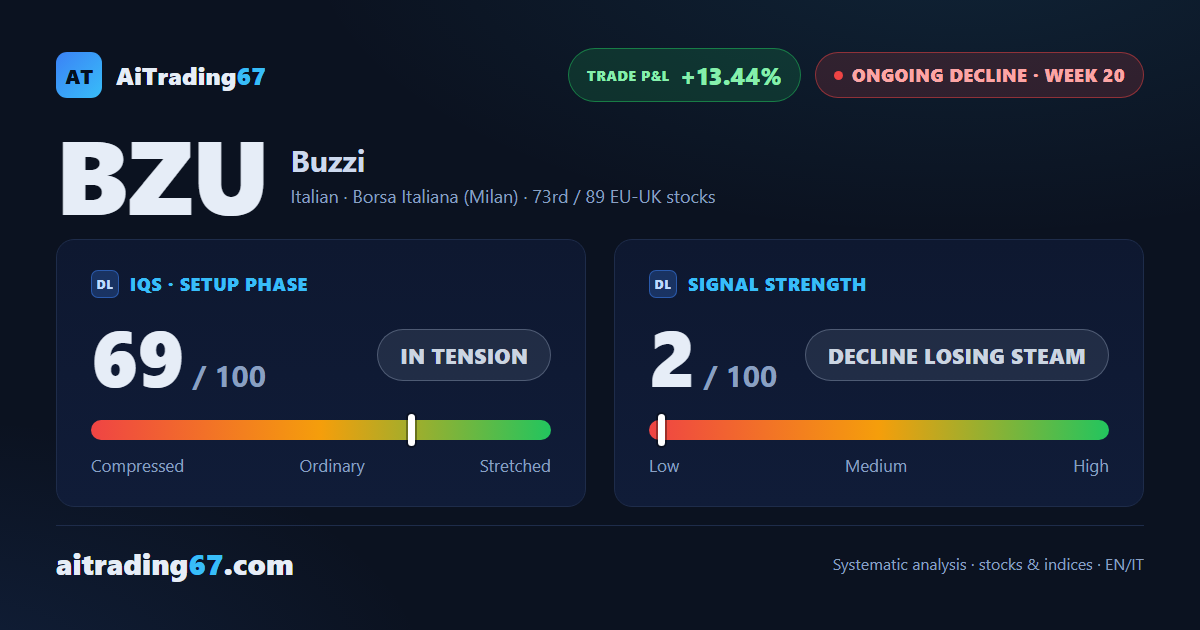
69
in tension
Signal Strength
2
decline losing steam
Sizing
MINIMUM
Ranking
#73 / 89
EU-UK stocks
Trade P&L %
+13.44%
from signal to date, no stop loss
Buzzi (BZU) weekly chart — EMA50 · MACD · VWAP
Weekly chart · EMA50 · MACD · VWAP · Source: TradingView
Rank position
ranks 73rd among the 89 sell signals for European-UK stocks in our ranking, with a signal strength of 2 out of 100.
Sector context
SectorItalian
Benchmark ETFEXV6
Sector regimeweak phase
Performanceweekly -0.36% · monthly -4.97%
BZU belongs to the italian sector (reference ETF EXV6). The sector is classified weak phase according to our weekly reading.
restricted Platinum content