
Buzzi's sell-off returns to bite
Buzzi drops 3.1% as its Sell signal comes back under pressure
Buzzi's sell-off returns to bite
Our view last week
Buzzi is in the seventh week of a sell signal, and the week that just closed came in at +0.4%, nearly flat after the prior week's 2.5% drop. Something is shifting technically: the MACD histogram has turned positive and selling flow is losing steam, while the support in the 43 area has already held through a double bottom with a 14% rebound.
This week's summary
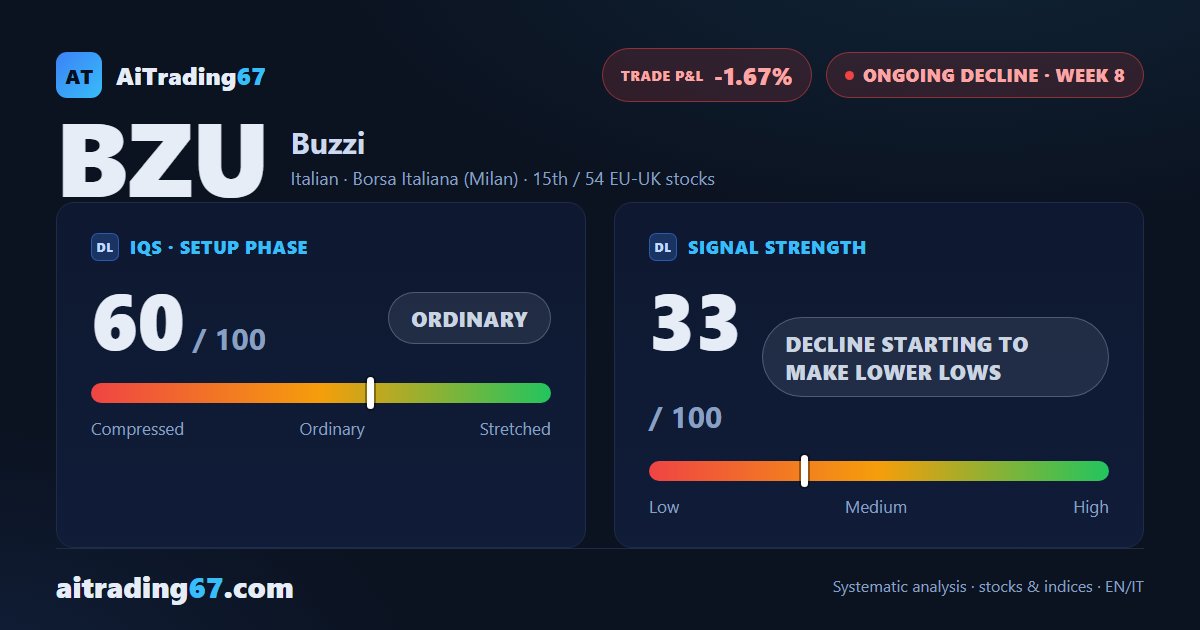
Buzzi shares fall back: after last week's rebound, when the MACD histogram turned positive, the stock dropped 3.1% and sellers took back control. The weekly RSI slides to its low for the past four weeks, but the signals stay weak, volume contracting and candle-body conviction fading. The double bottom in the 43 area still holds, while the short sits close to breakeven, at -1.67%.
IQS Phase
60
ordinary
Signal Strength
33
decline starting to make lower lows
Sizing
REDUCED
Ranking
#15 / 54
EU-UK stocks
Trade P&L %
-1.67%
from signal to today
restricted Platinum content