
Citigroup: a fresh sell signal
Citigroup drops 8.1% as a fresh sell signal kicks in
Citigroup: a fresh sell signal
Our view last week
Citigroup shares bounce 3% off their own 20-day moving average, in the 140 area, closing the week with a modest +0.6%. This week's technical analysis shows buyers clawing back ground after a low two weeks ago, while momentum keeps cooling and money flow stays negative. Price is now boxed into a tight band between resistance and support, and earnings - a full two weeks out last week - are now just around the corner: July 14.
This week's summary
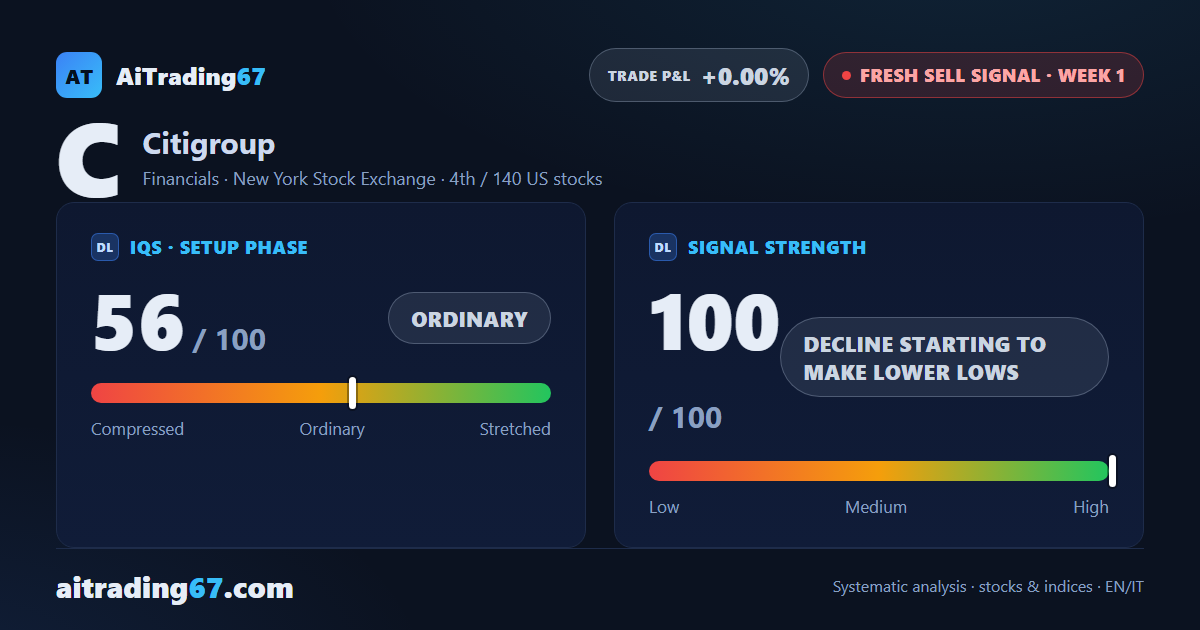
This week Citigroup's stock drops 8.1%, with sellers firmly in control and a distribution phase underway: buyer dominance has collapsed and the last bar saw sellers take over in extreme fashion. A fresh sell signal has kicked in, ranking 4th among the 140 US stocks under a sell signal in our weekly technical analysis. The price still sits well above its 200-week average, and the financial sector keeps showing real strength.
IQS Phase
56
ordinary
Signal Strength
100
decline starting to make lower lows
Sizing
STANDARD
Ranking
#4 / 140
New us stocks
Trade P&L %
+0.00%
from signal to today
restricted Platinum content