
Citigroup: the Sell signal still lacks confirmation
Citigroup stock flat (+0.2%): the Sell signal stays without fresh push
Citigroup: the Sell signal still lacks confirmation
Our view last week
Citigroup shares bounce 2.2% off a clean double bottom in the 131 area, but money flow stays negative and sellers still have the upper hand on volume. The Sell signal is in its second week and confirmation hasn't arrived yet: signal strength drops to 40 out of 100, an isolated decline with no new lows. After last week's 8.1% plunge, the stock still trades well above its 200-week average; our weekly technical analysis flags trading as not recommended for a fresh entry.
This week's summary
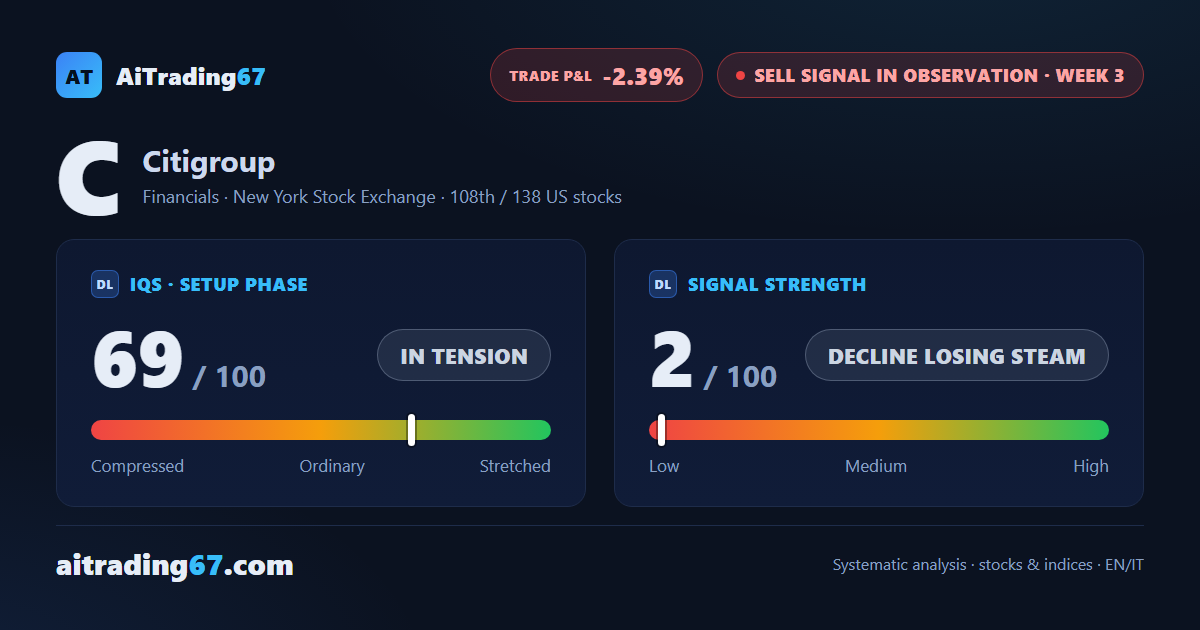
Citigroup stock stays flat this week (+0.2%), and the price has returned to a level already touched in the 127 area, with no session defending it yet: for now the move under way continues. The Sell signal reaches its third week without a fresh push — strength drops to 2 out of 100 — while the stock stays boxed between the 133 and 129 areas, still well above its 200-week average. Our weekly technical analysis flags trading as not recommended.
IQS Phase
69
in tension
Signal Strength
2
decline losing steam
Sizing
MINIMUM
Ranking
#108 / 138
US stocks sell signals
Trade P&L %
-2.39%
from signal to date, no stop loss
Rank position
ranks 108th among the 138 sell signals for US stocks in our ranking, with a signal strength of 2 out of 100.
Sector context
SectorFinancials
Benchmark ETFXLF
Sector regimein strong phase
Performanceweekly +1.12% · monthly +3.94%
C belongs to the financials sector (reference ETF XLF). The sector is classified in strong phase according to our weekly reading.
restricted Platinum content