EN IT

Capgemini: 20 weeks into a decline, something stirs beneath

Week 20 of the sell signal on Capgemini SE. The week closed down 5% with sellers at 69%, but beneath the surface something shifts: CMF back in positive territory, MACD histogram compressing. The decline holds, but momentum is fading.

Capgemini: 20 weeks into a decline, something stirs beneath
Sell signal — week 20
Capgemini: 20 weeks into a decline, something stirs beneath
June 12, 2026
Sell signal — week 20
In Summary
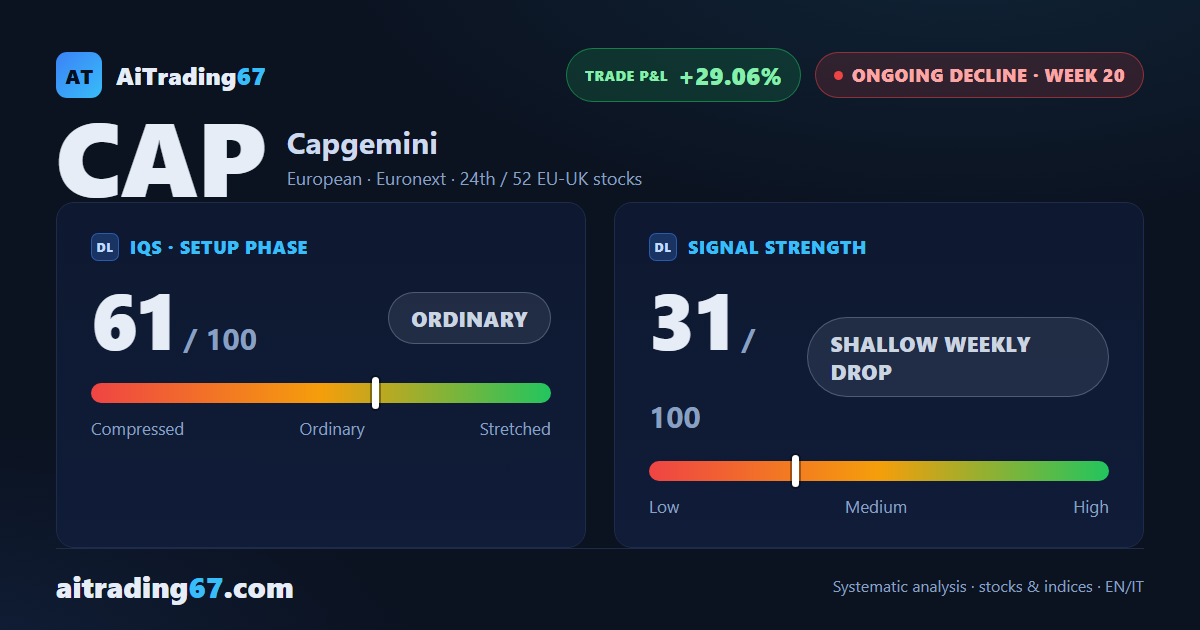
Capgemini SE is at week 20 of a sell signal, with a 29% gain accumulated from the opening. The latest week closed down 5% on dominant sell volume, but technical indicators paint a mixed picture: distribution underway, yet CMF back in positive territory and the MACD histogram in progressive compression. The decline holds, but internal dynamics warrant attention.
Ongoing decline ·20th week from start ·EU-UK stocks ·T2 ★ See Gold version →
IQS Phase
61
ordinary
Signal Strength
31
shallow weekly drop
Sizing
REDUCED
Ranking
#24 / 52
EU-UK stocks
Trade P&L %
+29.06%
from signal to today
Chart · Weekly — EMA50 · MACD · VWAP
Weekly chart · EMA50 · MACD · VWAP · Source: TradingView
How to read this pageA visual guide to the post, card by card
The full analysis, operating plan and detailed levels on this asset are reserved for clients ★ PLATINUM
restricted Platinum content
Share WhatsApp Telegram Gmail LinkedIn