
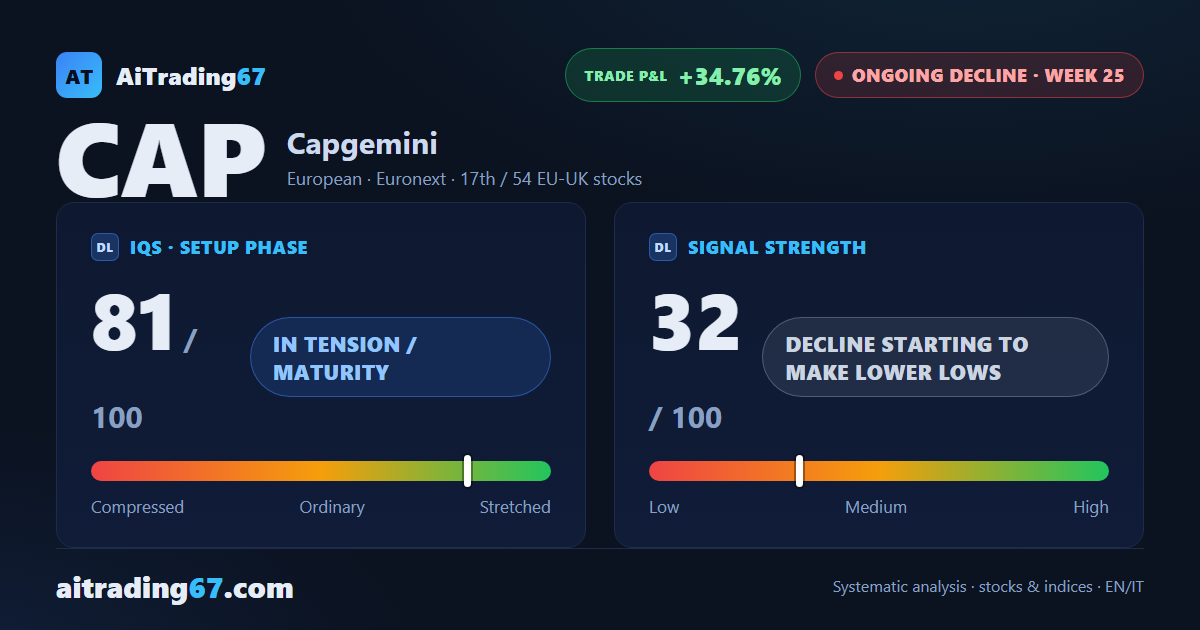
Capgemini: the bounce stalls, sellers return
Capgemini shares drop 3.2%, retesting double-bottom support near 86
Capgemini: the bounce stalls, sellers return
Our view last week
Week 24 of a sell signal on Capgemini, and the week just closed gained 2.5%, with buy volume climbing to 95%. On the daily chart a double bottom has formed in the 86 area, with an intermediate rebound of 13%. Earnings are approaching, in three to four weeks: whether this rebound holds is worth watching well before that date.
This week's summary
Last week's bounce in Capgemini has already stalled: shares dropped 3.2% and slipped back to retest the double-bottom level near 86, with sellers back in control after a week that was almost entirely buy-side. This week's technical analysis shows a picture still mixed — RSI around 35, MACD at its lowest point in four weeks — while the short, open for 25 weeks, remains up more than 34%.
IQS Phase
81
in tension / maturity
Signal Strength
32
decline starting to make lower lows
Sizing
REDUCED
Ranking
#17 / 54
EU-UK stocks
Trade P&L %
+34.76%
from signal to today
restricted Platinum content