
Momentum cools, money flow turns
Caterpillar slips 1.2% as money flow turns negative and the rally loses steam
Momentum cools, money flow turns
Our view last week
Caterpillar is at week 12 of a buy trade that has already completed the model's coverage: all 3 references of our most advanced model have been hit, the stop has moved to breakeven, and the residual capital is running at +21.86% since entry. On the technical side, the week just closed held steady, but with a few mixed signals worth watching closely.
This week's summary
Caterpillar closed the week down 1.2%, the second straight decline after mid-June's sharp rally. In the weekly technical picture the clearest signal comes from money flow, which has turned negative after weeks in positive territory, while RSI and momentum cool off from overbought extremes. The trend still holds - ADX above 52 - but price action points to a distribution phase: Caterpillar stock is catching its breath just under resistance.
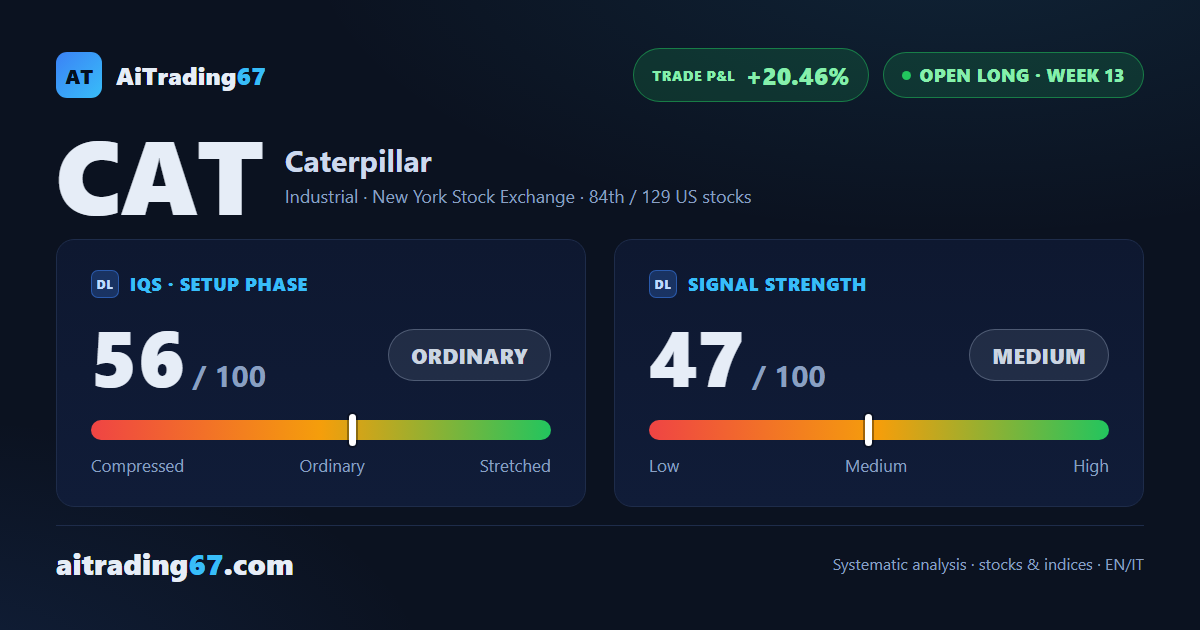
IQS Phase
56
ordinary
Signal Strength
47
medium · weak
Sizing
REDUCED
Ranking
#84 / 129
US stocks in progress
Trade P&L %
+20.46%
from signal to today
restricted Platinum content