
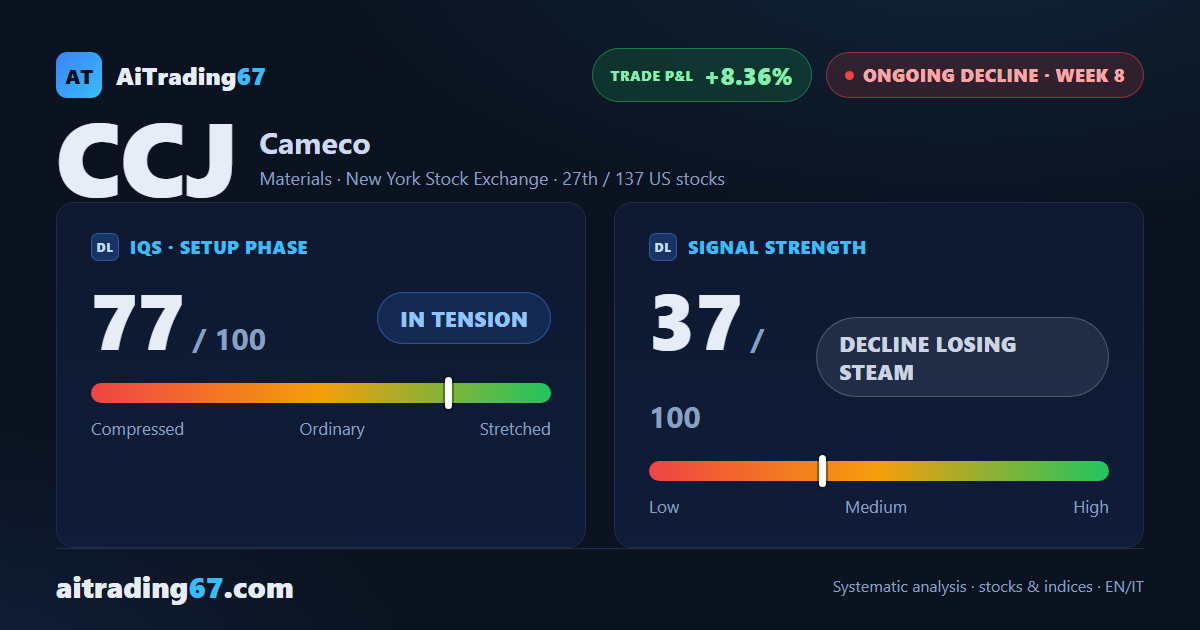
Cameco's sell pauses on the surface only
Cameco barely moves (-0.6%): money flow slides to new lows, MACD turns negative
Cameco's sell pauses on the surface only
Our view last week
Cameco is in week 7 of a sell signal, now well into its management phase. The week just closed dropped 7.6%, with sell volume climbing to 83% and technical momentum turning sharply worse again after a mid-June recovery attempt. The short position open on this trade remains up 7.84% since entry.
This week's summary
Cameco shares closed a nearly flat week (-0.6%) after the 7.6% plunge two weeks back, with sell volume finally easing off the wave that had dominated the tape. In this week's technical analysis, the picture beneath the surface keeps souring: money flow has slid to its lowest point of the period, and the weekly MACD has just turned negative. The daily double bottom in the 93 area is holding, with the short now up more than 8%.
IQS Phase
77
in tension
Signal Strength
37
decline losing steam
Sizing
REDUCED
Ranking
#27 / 137
US stocks
Trade P&L %
+8.36%
from signal to today
restricted Platinum content