
From buy to sell: Carnival's reversal
Carnival drops 3.9% and flips from a buy to a fresh Sell signal
From buy to sell: Carnival's reversal
Our view last week
Carnival is in week 3 of a buy signal, with the confirmation week closing higher. Signal strength is high, at 70 out of 100, on a wide and volatile move: on the daily chart, a double bottom is in place in the 25 area with an intermediate rebound of 14%. The stock ranks 40th among the 125 US stock buys currently open, listed on the New York Stock Exchange.
This week's summary
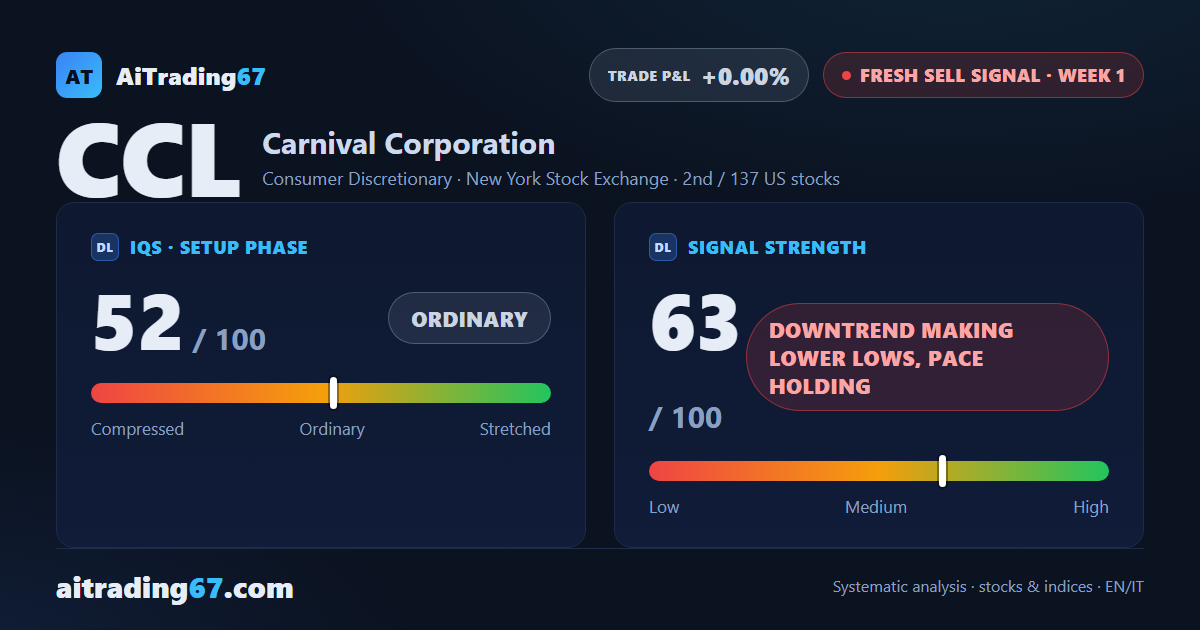
Carnival's picture flipped in just seven days: last week the stock was still in week 3 of a confirmed buy, with signal strength at 70; this week a 3.9% drop triggered a fresh Sell signal, 2nd among the 137 US sell signals in our ranking. Carnival weekly technical analysis: price is boxed between the daily pivot point in the 27 area and the Kumo ceiling in the 26.8 area, with the stock still 13.3% above its 200-week average.
IQS Phase
52
ordinary
Signal Strength
63
downtrend making lower lows, pace holding
Sizing
STANDARD
Ranking
#2 / 137
New us stocks
Trade P&L %
+0.00%
from signal to today
restricted Platinum content