
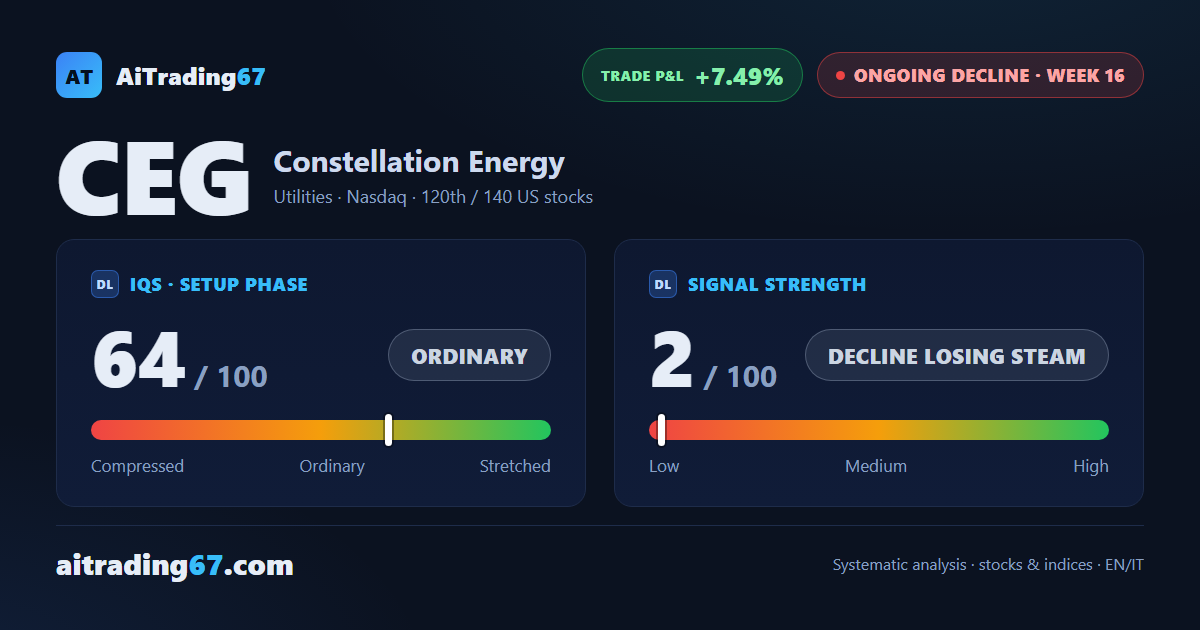
Constellation Energy: the decline eases its pace
Constellation Energy edges up 0.4% as the decline tightens between the 250 and 255 areas
Constellation Energy: the decline eases its pace
Our view last week
Constellation Energy bounced 5.1% this week on buying volume at 92% of the tape, pushing price up against its 7-day high. The Sell signal has been under management since week 15, with the short up roughly 8%. Underneath, though, the picture doesn't fully convince: momentum accelerated to the downside and the weekly MACD kept worsening.
This week's summary
Constellation Energy remains under a Sell signal in management since week 15, with the short up 7.49%. In this week's technical analysis the stock barely moved (+0.4%), but the internal picture is improving: the MACD histogram is fading and money flow is easing its downward pressure. Price stays boxed between the 255 area and the 250 area, above the double bottom in the 239 area.
IQS Phase
64
ordinary
Signal Strength
2
decline losing steam
Sizing
MINIMUM
Ranking
#120 / 140
US stocks
Trade P&L %
+7.49%
from signal to today
restricted Platinum content