
Sell signal, week 3 · US stocks
Charles Schwab slips 2.4% below its 200-day average with earnings 2 weeks out
Our view last week
Charles Schwab stock sheds 5.9%, stretching its losing run to 5 straight weeks: in the weekly bar buying fell below 25% of volume and sellers dominated to an extreme. The sell signal that fired a week ago is gathering pace, with the decline making lower lows. Yet the price action lands the stock on a tight band of supports, the 200-day moving average in the 98.6 area among them: our technical analysis flags fresh shorts as not recommended here.
This week's summary
The band of supports the stock was resting on a week ago has given way: with another 2.4% drop, Charles Schwab stock closes below both its 200-day and its 50-week moving average, and the weekly MACD slips under its Signal line after 13 weeks. It is the 6th straight weekly decline, with the daily RSI under 30. Among US stocks on a Sell signal this one still stands, but the price action is stretched and earnings on October 15 are close: opening fresh shorts here stays not recommended.
Sell signal in observation
·3rd week from start
·US stocks
·T2
·📅 Earnings · Oct 15
★ See Gold version →
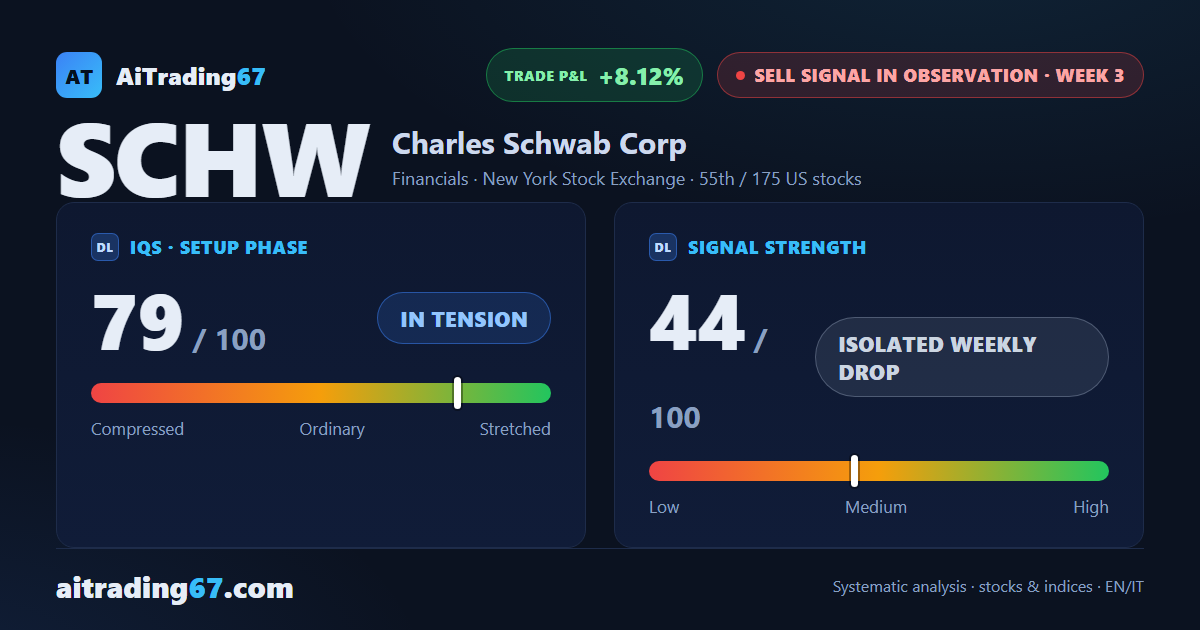
IQS Phase
79
in tension
Signal Strength
44
isolated weekly drop
Sizing
REDUCED
Ranking
#55 / 175
US stocks sell signals
Trade P&L %
+8.12%
from signal to date, no stop loss
Charles Schwab (SCHW) weekly chart — EMA50 · MACD · VWAP
Weekly chart · EMA50 · MACD · VWAP · Source: TradingView
Rank position
ranks 55th among the 175 sell signals for US stocks in our ranking, with a signal strength of 44 out of 100.
Sector context
SectorFinancials
Benchmark ETFXLF
Sector regimeweak phase
Performanceweekly -2.46% · monthly -7.23%
SCHW belongs to the financials sector (reference ETF XLF). The sector is classified weak phase according to our weekly reading.
restricted Platinum content