
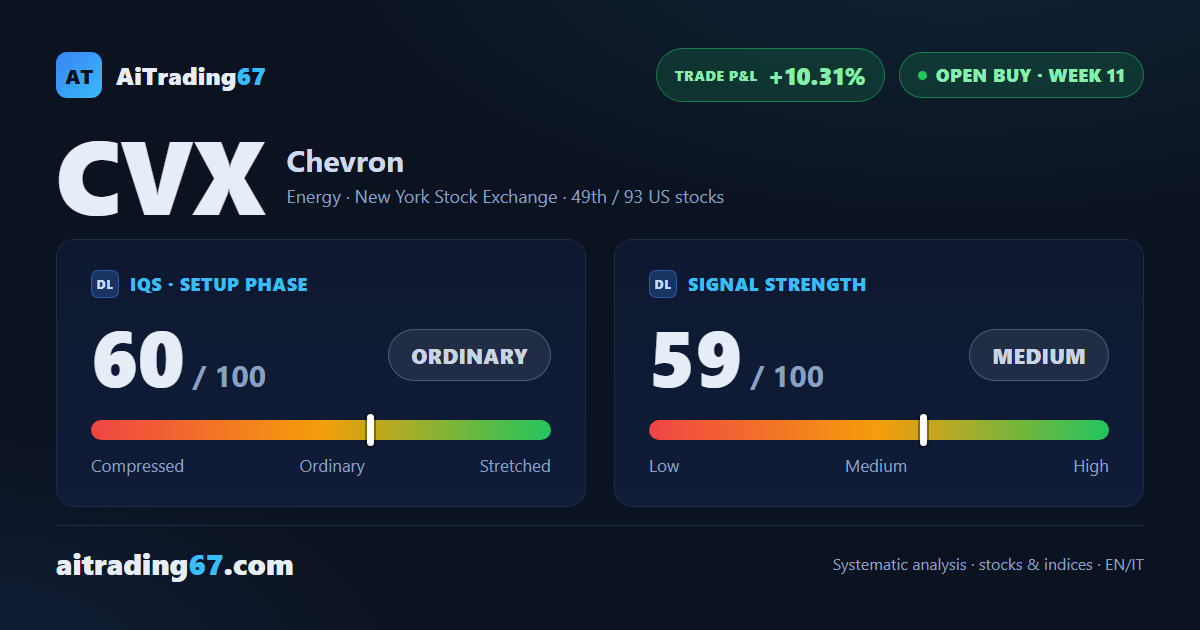
Open BUY · week 11 · US stocks
Chevron gains 1.1% and reclaims its 20-day average as the MACD loses pace
Our view last week
For the second week running, Chevron's weekly bar has gone to the sellers: the stock slipped 2.4% and dropped below its 20-day moving average. Chevron stock still holds above its 50-week average, with the MACD above its Signal line but deteriorating. In this week's technical analysis, price action has Chevron squeezed between the daily Inversion Point average, in the 204.8 area, and the 50-day moving average, in the 201.4 area. The trade stands at +9.1% from entry.
This week's summary
After 2 weeks of declines Chevron gains 1.1% and moves back above its 20-day moving average, lost a week ago. Price action is still tight: the stock sits between that average, in the 206.5 area, and the daily Inversion Point, in the 207.0 area. In this week's technical analysis Chevron stock holds above its 50-week average and the MACD stays above its Signal line, with the histogram falling for 3 weeks. Among US energy stocks with weekly buy signals, this one is up 10.3% since entry.
IQS Phase
60
ordinary
Signal Strength
59
medium
Sizing
STANDARD
Ranking
#49 / 93
US stocks in progress
Trade P&L %
+10.31%
from signal to date, no stop loss
Chevron (CVX) weekly chart — EMA50 · MACD · VWAP
Weekly chart · EMA50 · MACD · VWAP · Source: TradingView
Rank position
ranks 49th among the 93 Longs already running for US stocks in our ranking, with a signal strength of 59 out of 100.
Sector context
SectorEnergy
Benchmark ETFXLE
Sector regimein positive regime
Performanceweekly +1.26% · monthly -3.50%
CVX belongs to the energy sector (reference ETF XLE). The sector is classified in positive regime according to our weekly reading.
restricted Platinum content