
Open buy · week 6
Circle Internet drops 8.7% and loses its 20-week average: the buy signal barely holds
Our view last week
The 50-week average, which the price was testing a week ago, has turned the rally back: Circle Internet stock slips 3%, with sellers firmly in control of the weekly bar and volume contracting. The buy signal stays active and the trade sits just above entry, at +1.2%. In this week's technical analysis the MACD holds above its Signal line, while the histogram falls for the first time after 9 weeks of gains.
This week's summary
Circle Internet drops 8.7% and in a single week loses its 20-week average, stopping right at the edge of the Inversion Point. After last week's rejection at the 50-week average, the technical analysis of Circle Internet stock weakens: the MACD histogram falls for the 2nd week and the buy signal holds by a narrow margin. Price closed below the breakeven stop flagged in last week's card (87.98 area): for anyone following that level the trade is closed.
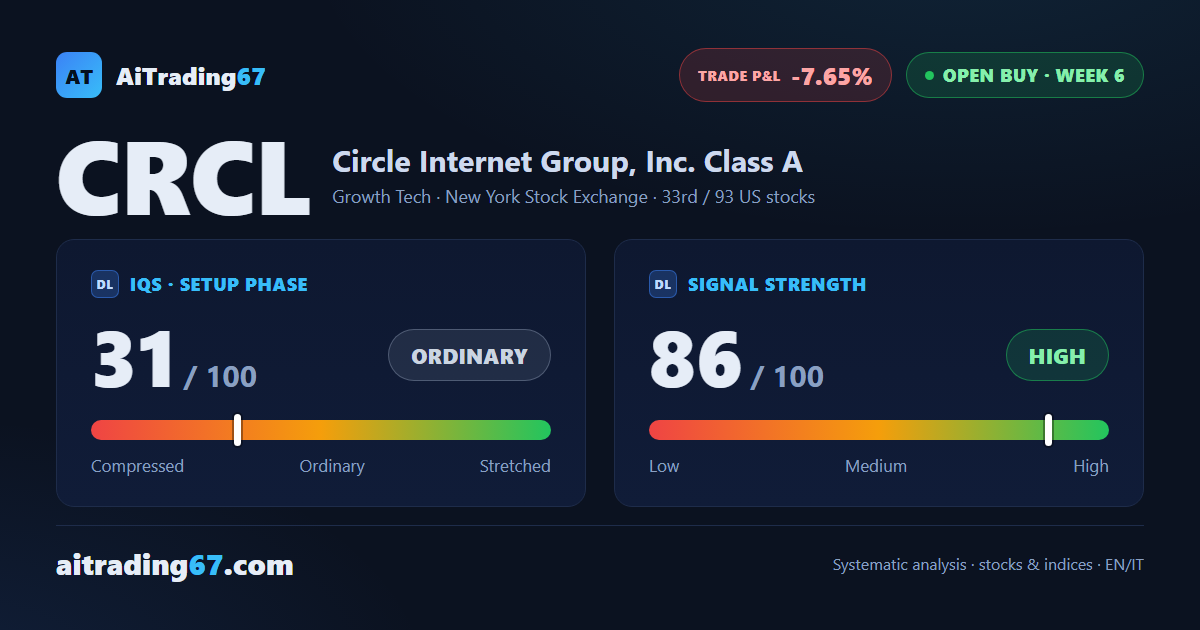
IQS Phase
31
ordinary
Signal Strength
86
high · wide & volatile
Sizing
FULL
Ranking
#33 / 93
US stocks in progress
Trade P&L %
-7.65%
from signal to date, no stop loss
Circle Internet (CRCL) weekly chart — EMA50 · MACD · VWAP
Weekly chart · EMA50 · MACD · VWAP · Source: TradingView
Rank position
ranks 33rd among the 93 Longs already running for US stocks in our ranking, with a signal strength of 86 out of 100.
Sector context
SectorGrowth Tech
Benchmark ETFXLK
Sector regimein strong phase
Performanceweekly +1.80% · monthly +8.83%
CRCL belongs to the growth tech sector (reference ETF XLK). The sector is classified in strong phase according to our weekly reading.
restricted Platinum content