
Sell signal · week 12 · US stocks
Cisco rebounds 5.2% and reclaims its averages in the 109 area, wiping out the short's gain
Our view last week
Cisco gives up another 2.6% and sellers climb to 69% of weekly volume, up from 53% seven days ago. For Cisco stock the price action still leans lower: the cluster of moving averages in the 109 area has turned the price back for the 4th time, and money flow keeps sliding below zero. Among US tech stocks, our technical analysis keeps tracking the sell signal, with the short up 4.7% since entry.
This week's summary
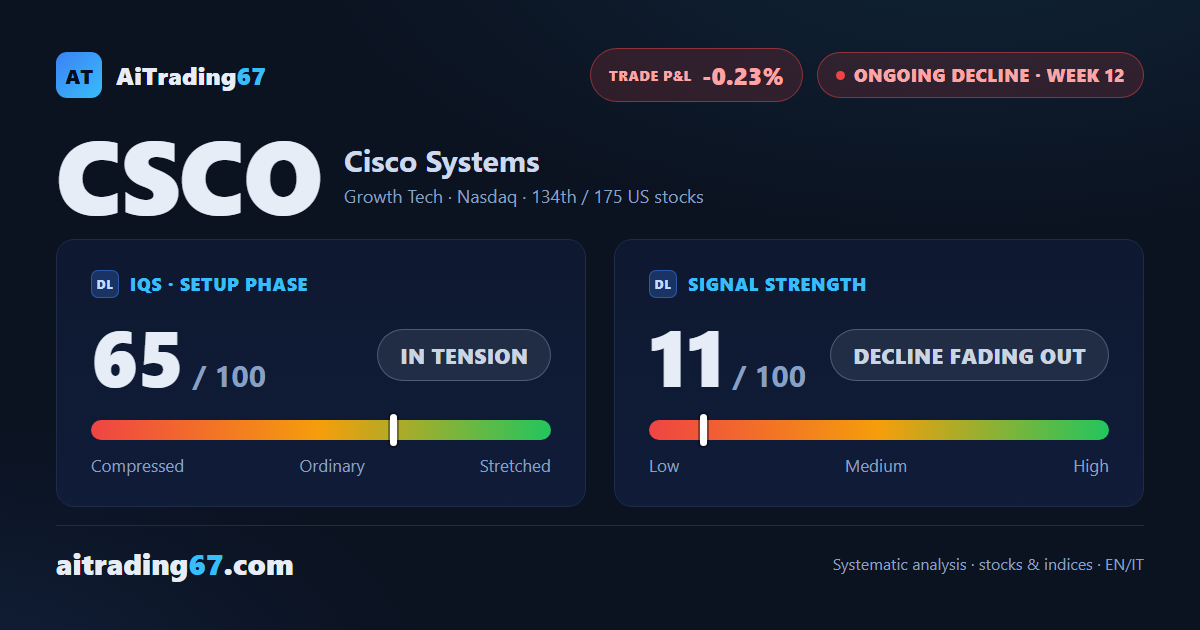
Cisco rebounds 5.2% off its 20-day average and takes back the cluster of moving averages in the 109 area, which it had closed below a week ago. For Cisco stock the price action changes tone, yet the signal is still a sell: the weekly MACD sits below its Signal line and money flow stays negative, though improving. The short, in week 12, is back to flat against its entry, with the Inversion Point just above, in the 115 area. One of the US tech stocks to watch this week.
IQS Phase
65
in tension
Signal Strength
11
decline fading out
Sizing
MINIMUM
Ranking
#134 / 175
US stocks
Trade P&L %
-0.23%
from signal to date, no stop loss
Cisco Systems (CSCO) weekly chart — EMA50 · MACD · VWAP
Weekly chart · EMA50 · MACD · VWAP · Source: TradingView
Rank position
ranks 134th among the 175 sell signals for US stocks in our ranking, with a signal strength of 11 out of 100.
Sector context
SectorGrowth Tech
Benchmark ETFXLK
Sector regimein strong phase
Performanceweekly +1.80% · monthly +8.83%
CSCO belongs to the growth tech sector (reference ETF XLK). The sector is classified in strong phase according to our weekly reading.
restricted Platinum content