
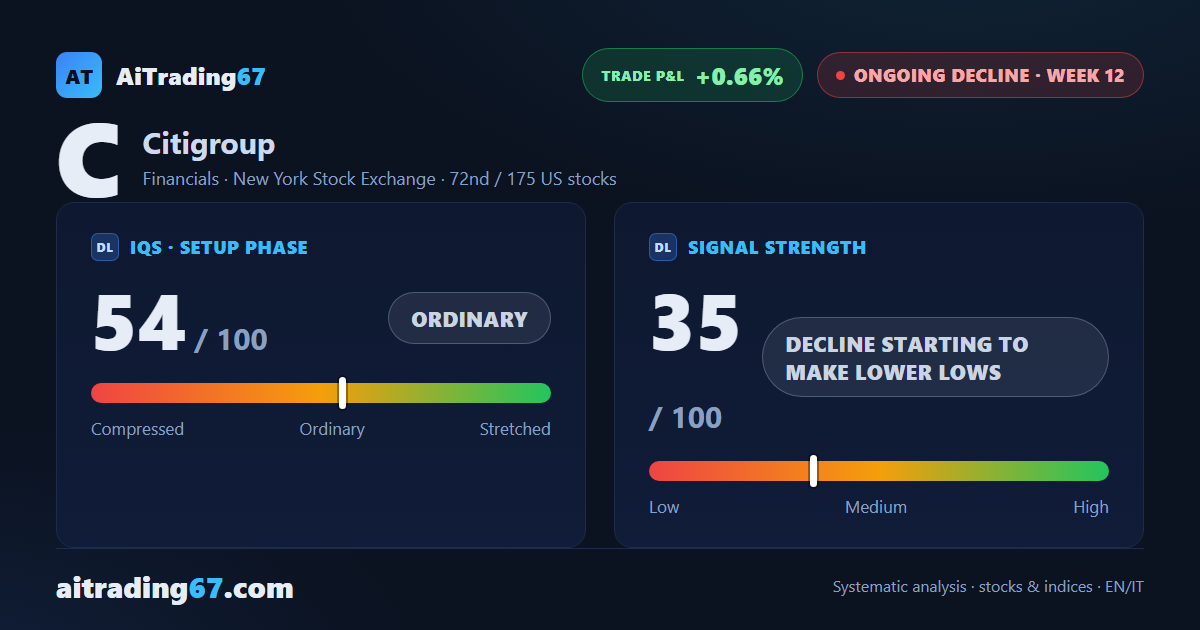
Citigroup · Sell signal, week 12
Citigroup drops 4.3%: fresh 30-day low, and the 200-day average holds
Our view last week
After last week's drop, Citigroup stock has turned: the week closes up 1.9% with 72% of volume on the buy side, and money flow is back above zero. On the daily chart price bounced 2% off the 20-day moving average, in the 134 area, yet the weekly bar has a weak body and the MACD stays below its Signal line. On the technical analysis, the sell signal is stalling, with the short down 3.8%: next week's price action will set the direction, a case to watch among US stocks for swing trading.
This week's summary
Citigroup stock fell 4.3% and wiped out last week's bounce: during the week price set a fresh 30-day low, in the 124 area, then recovered to close back above its 200-day moving average. On the technical analysis the decline moves in fits and starts: the MACD has sat below its Signal line for 11 weeks, while money flow stays positive. The short is back to a slim gain and earnings land on October 13: one to track through price action among US stocks, with a swing trading horizon.
IQS Phase
54
ordinary
Signal Strength
35
decline starting to make lower lows
Sizing
REDUCED
Ranking
#72 / 175
US stocks
Trade P&L %
+0.66%
from signal to date, no stop loss
Citigroup (C) weekly chart — EMA50 · MACD · VWAP
Weekly chart · EMA50 · MACD · VWAP · Source: TradingView
Rank position
ranks 72nd among the 175 sell signals for US stocks in our ranking, with a signal strength of 35 out of 100.
Sector context
SectorFinancials
Benchmark ETFXLF
Sector regimeweak phase
Performanceweekly -2.46% · monthly -7.23%
C belongs to the financials sector (reference ETF XLF). The sector is classified weak phase according to our weekly reading.
restricted Platinum content