
CleanSpark bounces cautiously after the drop
CleanSpark bounces 1.8% off the double bottom, the picture stays unsettled
CleanSpark bounces cautiously after the drop
Our view last week
A fresh sell signal fires on CleanSpark, in week 1: this week's close gave back 22.7%, one of its sharpest drops in recent history, and the decline is making lower lows, pace holding, with a signal strength of 100 out of 100. The stock ranks 108th among the 137 US sell signals, and our quality band flags trading not recommended on a new opening. The confirmation week is still in progress, outcome still to be determined.
This week's summary
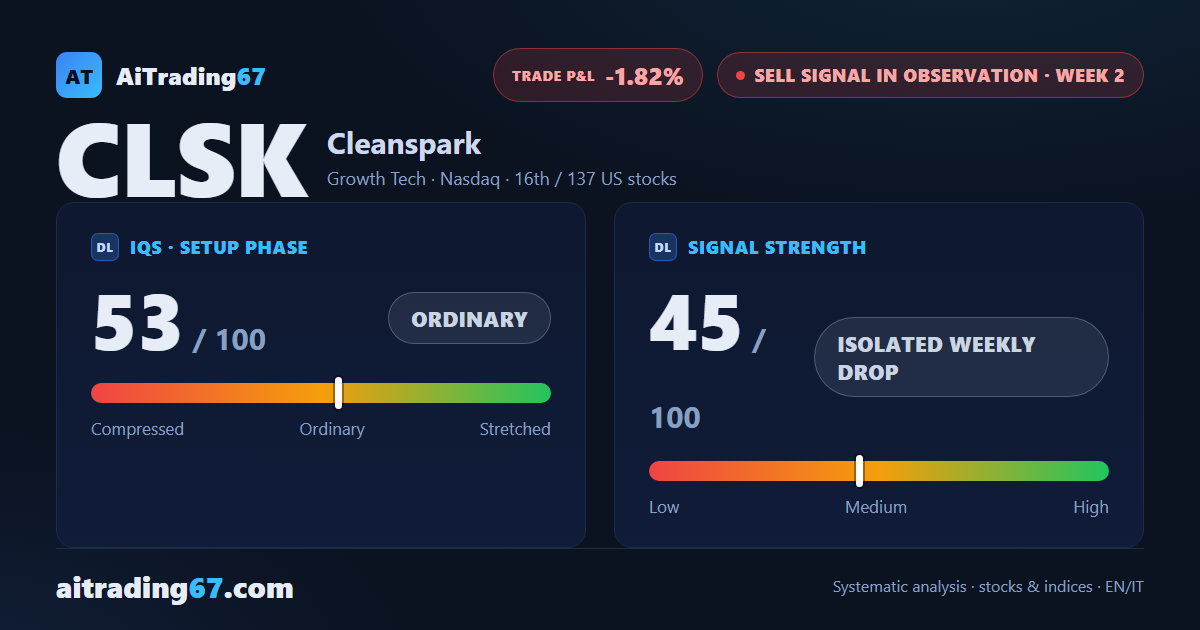
CleanSpark shares bounce 1.8% off a daily double bottom in the 12 area, with an intermediate rebound already at 14%. But the weekly candle stays indecisive, sellers are still slightly in charge, and daily money flow is negative. Our technical analysis reads last week's 22.7% drop as an "isolated weekly drop": a read still to be confirmed, with volatility staying very high. The quality band flags trading as not recommended.
IQS Phase
53
ordinary
Signal Strength
45
isolated weekly drop
Sizing
REDUCED
Ranking
#16 / 137
US stocks sell signals
Trade P&L %
-1.82%
from signal to today
restricted Platinum content