
Sell signal, week 3: the push is fading
CleanSpark rises 1.4% as the Sell signal loses steam near support
Sell signal, week 3: the push is fading
Our view last week
CleanSpark shares bounce 1.8% off a daily double bottom in the 12 area, with an intermediate rebound already at 14%. But the weekly candle stays indecisive, sellers are still slightly in charge, and daily money flow is negative. Our technical analysis reads last week's 22.7% drop as an "isolated weekly drop": a read still to be confirmed, with volatility staying very high. The quality band flags trading as not recommended.
This week's summary
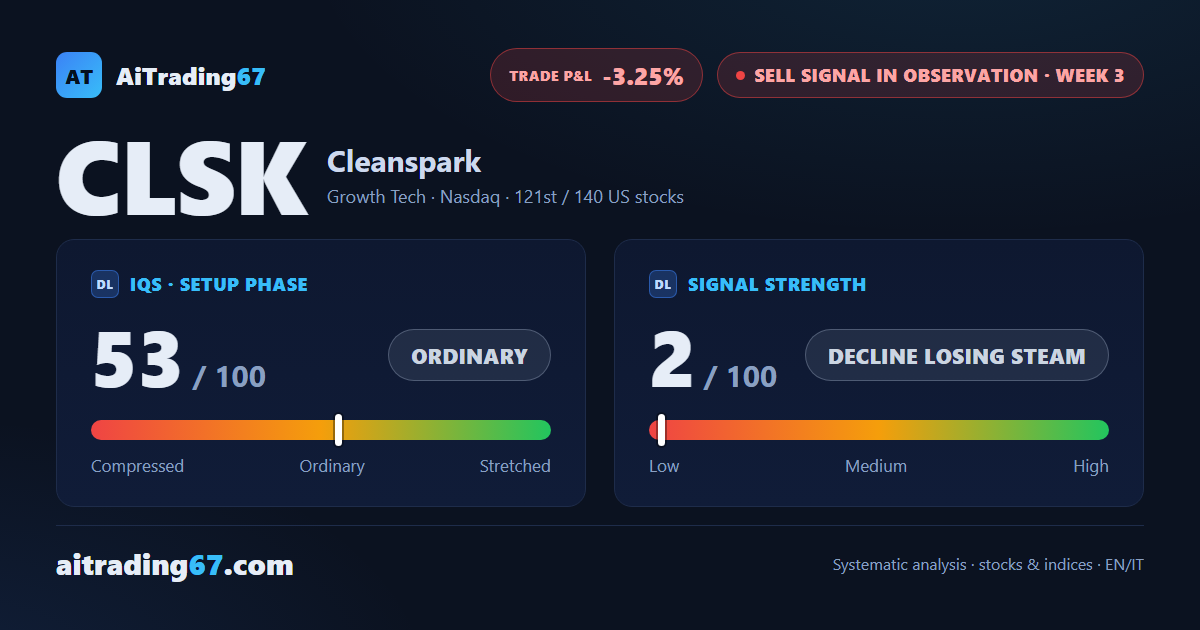
In our weekly technical analysis, CleanSpark shares stay boxed into a tight band, between the daily Kumo floor and the 20-week average just above (the 13.6 area) and the 200-day average just below (the 12.95 area). The double bottom in the 12 area has already produced a 26% intermediate rebound. The Sell signal is in its third week and strength drops to 2 out of 100 — a decline losing steam — while sellers, still slightly in charge, are giving up ground. Volatility stays very high.
Sell signal in observation
·3rd week from start
·US stocks
·T2
·📅 Earnings · Aug 11
★ See Gold version →
IQS Phase
53
ordinary
Signal Strength
2
decline losing steam
Sizing
MINIMUM
Ranking
#121 / 140
US stocks sell signals
Trade P&L %
-3.25%
from signal to today
restricted Platinum content