EN IT

CME Group at week 12: the decline holds, but signals are growing mixed

CME Group · week 12 sell signal — weekly technical analysis shows an 8.6% drop with sellers at 97%, yet a double bottom in the 245 area and mixed momentum signal caution before new short entries. Performance: +16% from inception.

CME Group at week 12: the decline holds, but signals are growing mixed
Ongoing decline · week 12
CME Group at week 12: the decline holds, but signals are growing mixed
June 19, 2026
Ongoing decline · week 12
In Summary
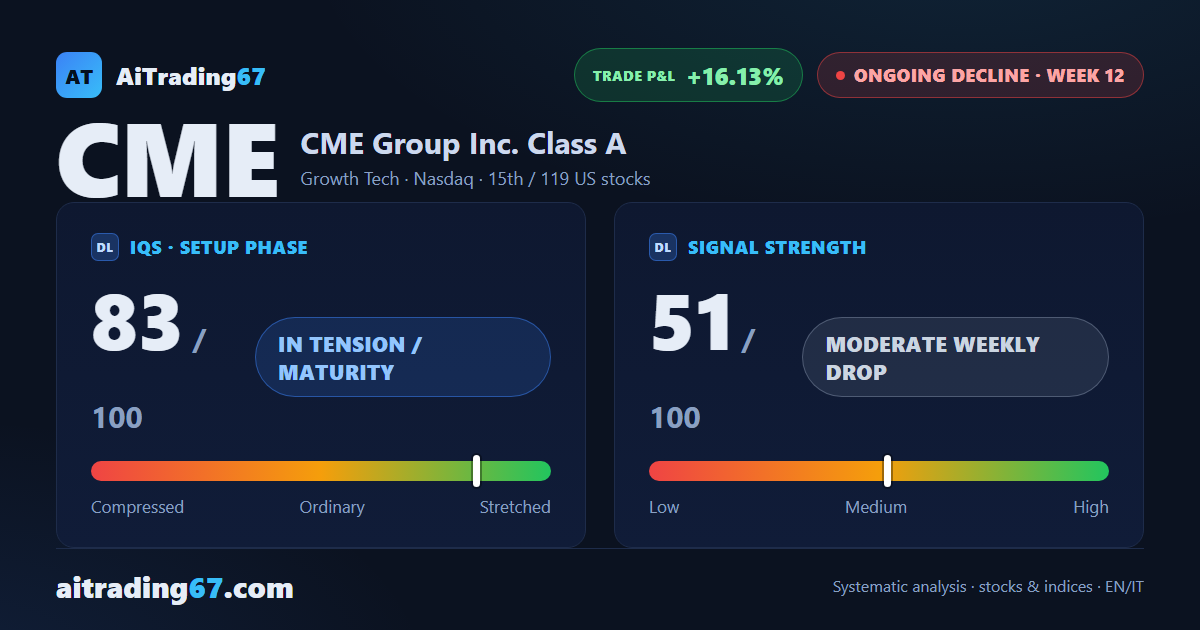
CME Group is in week 12 of a sell signal, with the trade having accumulated a 16% gain from inception. Last week closed down 8.6% with sellers at 97% — an accelerated drop. Yet a double bottom is forming in the 245 area on the daily chart, with a 10% intermediate bounce between the two lows, introducing a note of caution for anyone considering new short entries.
Ongoing decline ·12th week from start ·US stocks ·T2 ★ See Gold version →
IQS Phase
83
in tension / maturity
Signal Strength
51
moderate weekly drop
Sizing
STANDARD
Ranking
#15 / 119
US stocks
Trade P&L %
+16.13%
from signal to today
Chart · Weekly — EMA50 · MACD · VWAP
Weekly chart · EMA50 · MACD · VWAP · Source: TradingView
How to read this pageA visual guide to the post, card by card
The full analysis, operating plan and detailed levels on this asset are reserved for clients ★ PLATINUM
restricted Platinum content
Share WhatsApp Telegram Gmail LinkedIn