
CME Group · rebound losing steam
CME Group edges up 1.6% as the sell signal's rebound loses steam
CME Group · rebound losing steam
Our view last week
Week 15 of the sell signal on CME Group, up 19% since inception. The week closed with a 7.1% price bounce, but volume still favors sellers and the underlying technical picture hasn't turned: the decline is slowing, not fading out.
This week's summary
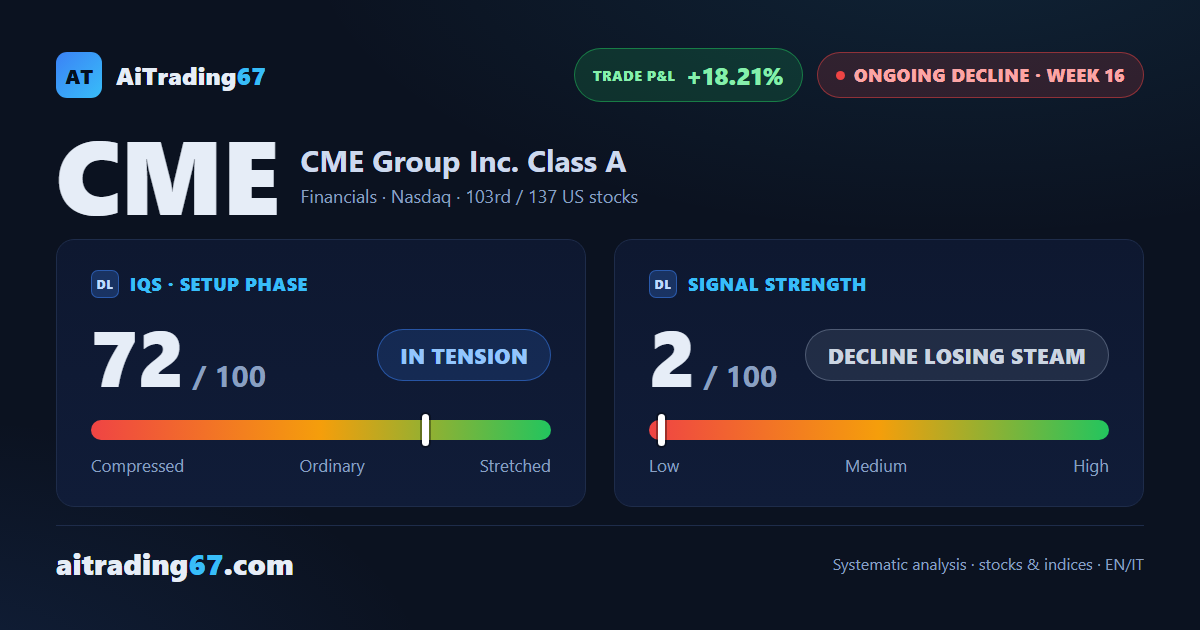
CME Group's rebound is losing steam: after a 7.1% bounce two weeks ago, the stock adds just 1.6% this week and stays boxed into a narrow corridor, between the daily Bollinger Band midline in the 241 area and the daily pivot average in the 240 area. The weekly technical picture still shows two heavy down weeks dominating, with money flow tilted toward sellers despite the bounce. The short has been open for 16 weeks, up 18%.
IQS Phase
72
in tension
Signal Strength
2
decline losing steam
Sizing
MINIMUM
Ranking
#103 / 137
US stocks
Trade P&L %
+18.21%
from signal to today
restricted Platinum content