
New Sell signal · US stocks
CME Group slips 0.5%, loses its 100-week average and a Sell signal kicks in
Our view last week
CME Group stock drops 4.2% and loses its cluster of moving averages between the 270 and 273 areas, with sellers ahead in the weekly bar. Price closed below the first stop level (SL1), the second stop level (SL2) and the breakeven stop flagged in last week's card (265.95 area, 265.44 area, 267.79 area): for anyone following those levels the trade is closed. The close and the Inversion Point, in the 266 area, have already crossed with no change of sign declared: one to watch in the coming sessions.
This week's summary
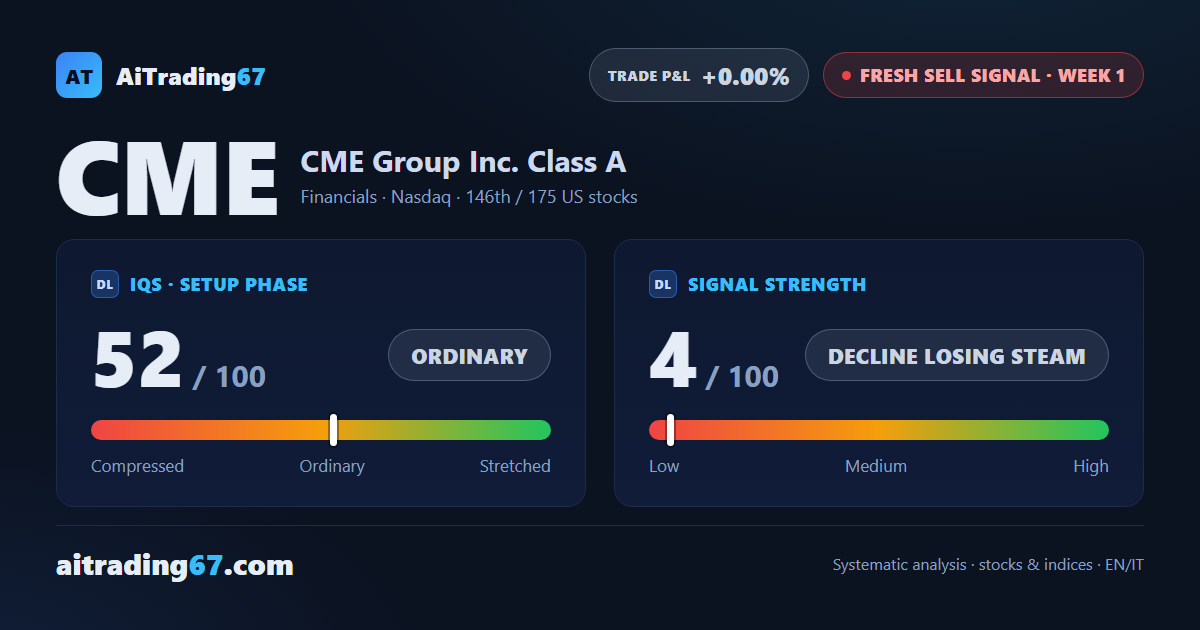
CME Group gives up another 0.5%, closes a touch under its 100-week average, in the 263 area, and the change of sign that was only in the air last week becomes a Sell signal. CME Group stock gets there with little push, though: signal strength is 4 out of 100, a decline losing steam, and the weekly ADX has been falling for 11 weeks. On our technical analysis, opening a short here is high-risk for swing trading: the confirmation week is still open.
IQS Phase
52
ordinary
Signal Strength
4
decline losing steam
Sizing
MINIMUM
Ranking
#146 / 175
New us stocks
Trade P&L %
+0.00%
from signal to date, no stop loss
Rank position
ranks 146th among the 175 sell signals for US stocks in our ranking, with a signal strength of 4 out of 100.
Sector context
SectorFinancials
Benchmark ETFXLF
Sector regimeweak phase
Performanceweekly -2.46% · monthly -7.23%
CME belongs to the financials sector (reference ETF XLF). The sector is classified weak phase according to our weekly reading.
restricted Platinum content