
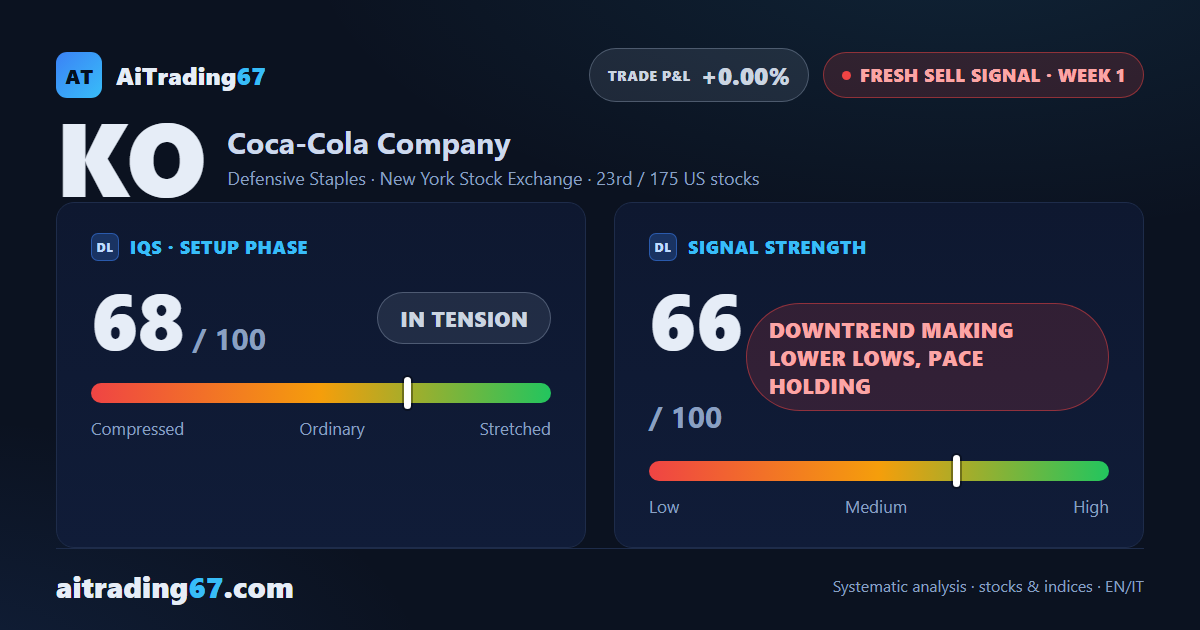
Fresh sell signal · week 1 · US stocks
Coca-Cola slips 2.5% as the weekly MACD drops below its signal line after 20 weeks
Our view last week
The weekly MACD histogram has fallen for a fifth week and now sits a hair above zero, while the 20-day average turns the price away once more. Coca-Cola stock slips 0.5%, with sellers ahead for a second week and money flow still below zero, though edging up. The price action is indecisive, and the rising ADX is what still props up the trend. Among US stocks with an open long, this one stands 8.65% above entry.
This week's summary
After 20 weeks above its signal line, Coca-Cola's weekly MACD has dropped below it, and a 2.5% slide carried the price to a fresh 30-day low. A week ago the histogram sat a hair above zero: now a new Sell signal is live on Coca-Cola stock. Price action shows a distribution phase and money flow stays negative, yet the price still trades above its 50-week average: on our technical analysis, from a swing trading angle, opening a short here is high-risk.
IQS Phase
68
in tension
Signal Strength
66
downtrend making lower lows, pace holding
Sizing
STANDARD
Ranking
#23 / 175
New us stocks
Trade P&L %
+0.00%
from signal to date, no stop loss
Coca-Cola (KO) weekly chart — EMA50 · MACD · VWAP
Weekly chart · EMA50 · MACD · VWAP · Source: TradingView
Rank position
ranks 23rd among the 175 sell signals for US stocks in our ranking, with a signal strength of 66 out of 100.
Sector context
SectorDefensive Staples
Benchmark ETFXLP
Sector regimeweak phase
Performanceweekly -1.86% · monthly -5.85%
KO belongs to the defensive staples sector (reference ETF XLP). The sector is classified weak phase according to our weekly reading.
restricted Platinum content