
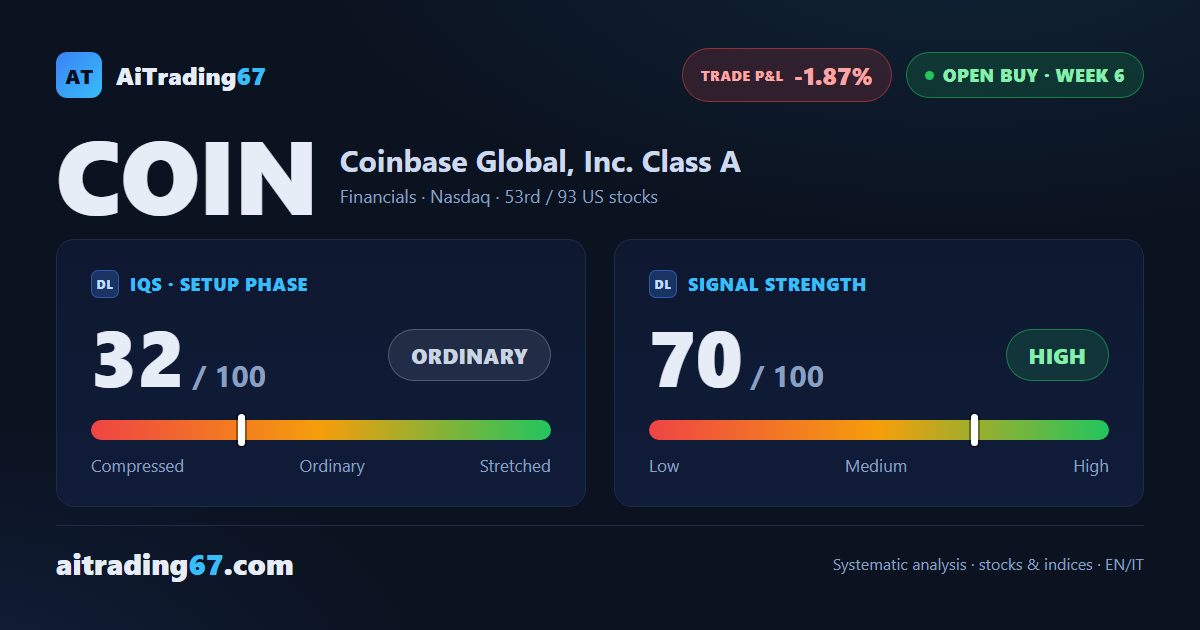
Open buy · week 6
Coinbase drops 6.2% as the 50-week average caps the stock again
Our view last week
Sellers took Coinbase's week: they dominated the weekly bar to an extreme, with buying below 25% of volume, and the stock closed a thin +0.4% after last week's +10.8%. Coinbase stock stays wedged between the 200-day moving average, in the 194 area, and the 50-week average, in the 199 area, which turned it back again. In technical analysis terms the buy signal holds, +4.6% since entry, but the push has stalled below resistance.
This week's summary
Coinbase lost 6.2% this week, ending a 2-week climb: the 50-week moving average, in the 199 area, capped it again and the stock fell back below its 200-day average. On technical analysis Coinbase stock stays in a buy signal, now below its entry level.
IQS Phase
32
ordinary
Signal Strength
70
high · wide & volatile
Sizing
FULL
Ranking
#53 / 93
US stocks in progress
Trade P&L %
-1.87%
from signal to date, no stop loss
Coinbase Global (COIN) weekly chart — EMA50 · MACD · VWAP
Weekly chart · EMA50 · MACD · VWAP · Source: TradingView
Rank position
ranks 53rd among the 93 Longs already running for US stocks in our ranking, with a signal strength of 70 out of 100.
Sector context
SectorFinancials
Benchmark ETFXLF
Sector regimeweak phase
Performanceweekly -2.46% · monthly -7.23%
COIN belongs to the financials sector (reference ETF XLF). The sector is classified weak phase according to our weekly reading.
restricted Platinum content