
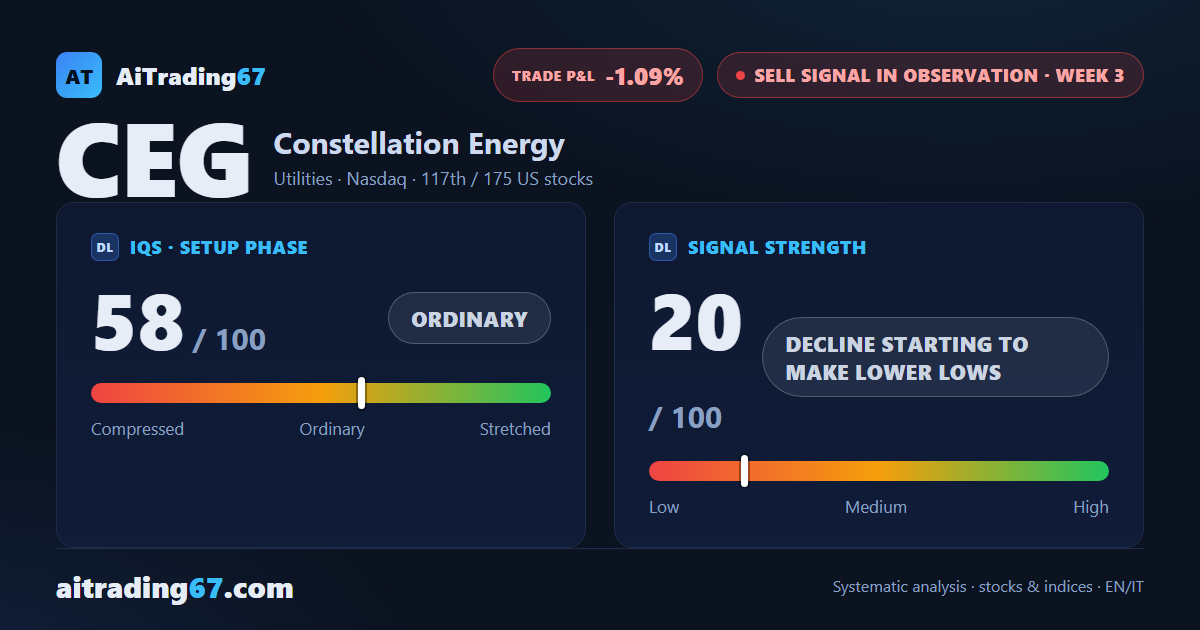
Sell signal in observation · week 3
Constellation Energy slips 2.2%: a fresh 30-day low the weekly close did not confirm
Our view last week
After last week's 10.5% drop, Constellation Energy stock has clawed back 3.4%, and the bounce leaves the pattern intact: 3 lower highs on the daily chart, from the 306 area to the 266 area, with money flow still negative. The strength of the Sell signal, at its peak a week ago, has lost most of its push: a decline no longer making new lows. For this technical analysis and trade setup, the price action says wait.
This week's summary
Turned back by the cluster of daily averages between the 265 and 269 areas, Constellation Energy stock slips 2.2% and prints a fresh 30-day low, in the 247 area, that the weekly close fails to confirm. Last week's bounce ended there. Money flow stays negative for a 3rd week and the strength of the Sell signal drops again. In this technical analysis the picture is still bearish but the price action is indecisive: among US stocks, a trade setup with little margin for a new short.
IQS Phase
58
ordinary
Signal Strength
20
decline starting to make lower lows
Sizing
MINIMUM
Ranking
#117 / 175
US stocks sell signals
Trade P&L %
-1.09%
from signal to date, no stop loss
Constellation Energy (CEG) weekly chart — EMA50 · MACD · VWAP
Weekly chart · EMA50 · MACD · VWAP · Source: TradingView
Rank position
ranks 117th among the 175 sell signals for US stocks in our ranking, with a signal strength of 20 out of 100.
Sector context
SectorUtilities
Benchmark ETFXLU
Sector regimeweak phase
Performanceweekly +0.81% · monthly -6.66%
CEG belongs to the utilities sector (reference ETF XLU). The sector is classified weak phase according to our weekly reading.
restricted Platinum content