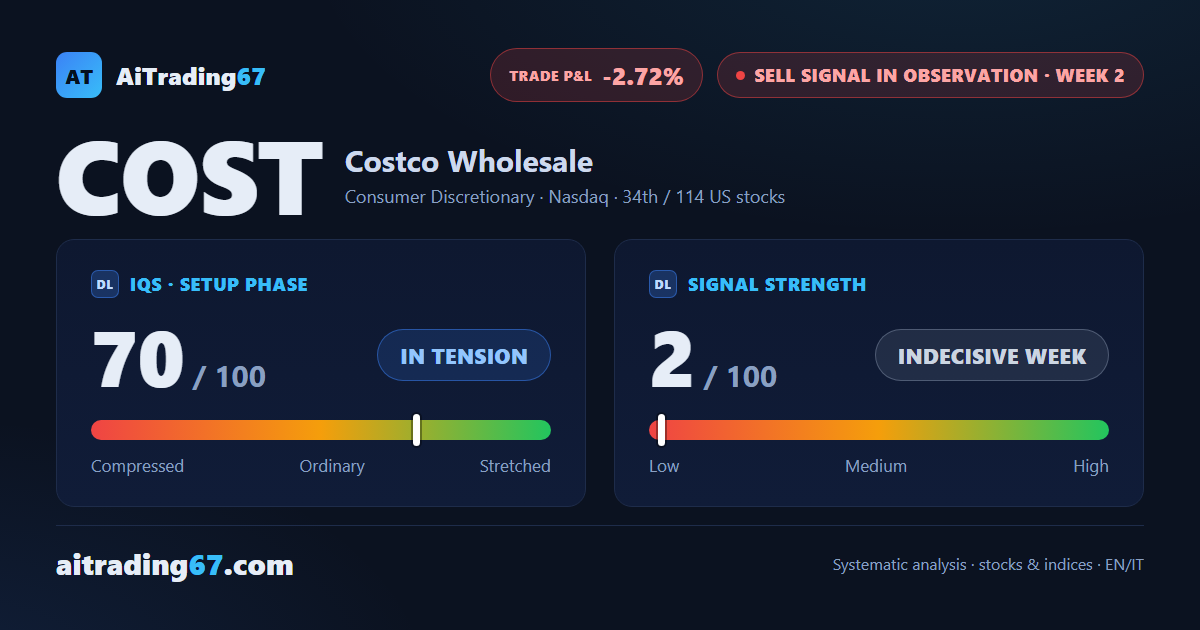
Sell signal in observation — week 2
Costco: sell signal active, but daily double bottom checks the decline
Sell signal in observation — week 2
In Summary
Costco is at week 2 of a sell signal: the week just closed was one of indecision — minimal decline, signal strength at 2 out of 100 — but the weekly structure remains bearish with IQS at 70 out of 100. A daily double bottom in the 949 area and a 22% gap above the 200-week moving average make opening a new short high-risk per our model. The confirmation week is still in progress.
IQS Phase
70
in tension
Signal Strength
2
indecisive week
Sizing
MINIMUM
Ranking
#34 / 114
US stocks sell signals
Trade P&L %
-2.72%
from signal to today
restricted Platinum content