
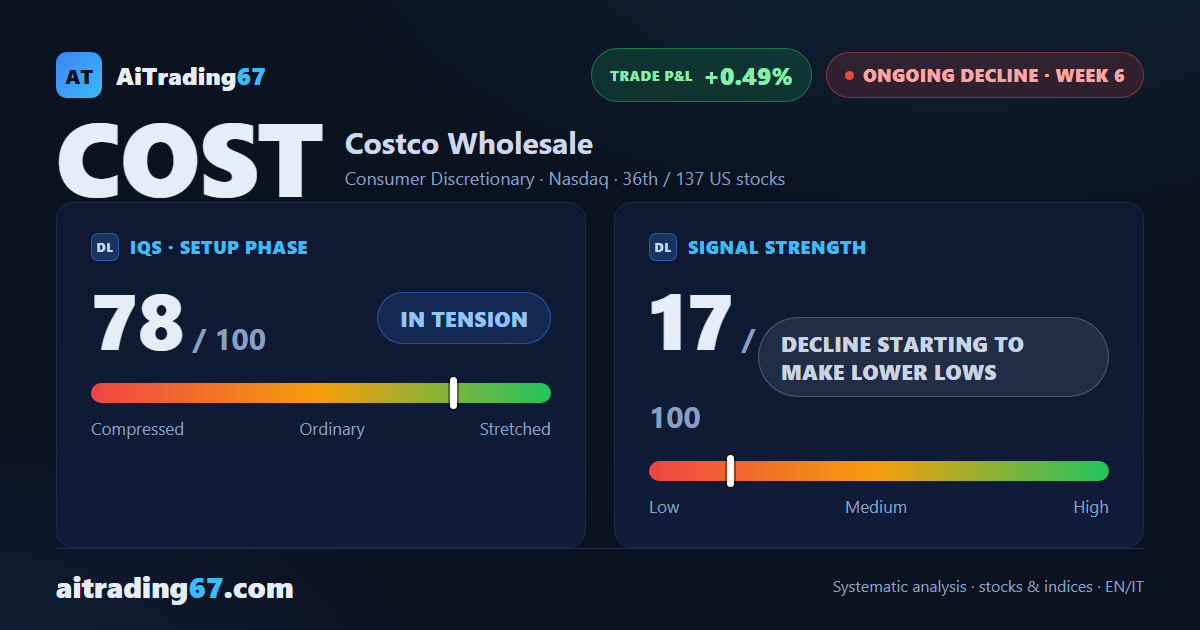
Costco · sell signal, week 6
Costco: week 6 of a sell signal, between a double bottom and weakening momentum
Costco · sell signal, week 6
In Summary
Costco is in the sixth week of a sell signal, and the week closed essentially flat after a double bottom in the 929 area with an intermediate rebound of 8%. The technical picture is mixed: volume has swung back to the buy side, but momentum stays weak and capital flow has turned negative again. Price sits between the first resistance, the 20-day moving average in the 960.5 area, and the first support, the daily pivot point in the 951.5 area: a phase of watching more than a clear direction.
IQS Phase
78
in tension
Signal Strength
17
decline starting to make lower lows
Sizing
MINIMUM
Ranking
#36 / 137
US stocks
Trade P&L %
+0.49%
from signal to today
restricted Platinum content