
Costco caught between a double bottom and deepening distribution
Costco slips 0.6% and stays directionless between a double bottom and distribution
Costco caught between a double bottom and deepening distribution
Our view last week
Costco's Sell signal has been under management since its seventh week, with the short at +1.6%. After last week's 3.7% drop, 85% of volume on the sell side and a new, lower low near the 914 area, the stock recovered 2.7% this week, with buyers back in the majority, 56% of volume. The bounce still looks tentative: the weekly RSI edges up to just 44.8, still below neutral, and money flow keeps worsening after a month.
This week's summary
Costco slips 0.6% and drifts without clear direction after last week's 2.7% bounce. The weekly RSI is stuck at 43.9, still below neutral, while money flow slides deeper into distribution. Buyers hold a thin majority, 60% of volume, but on the daily chart the structure still shows a double bottom in the 912 area, with an intermediate 6% bounce off the lows.
IQS Phase
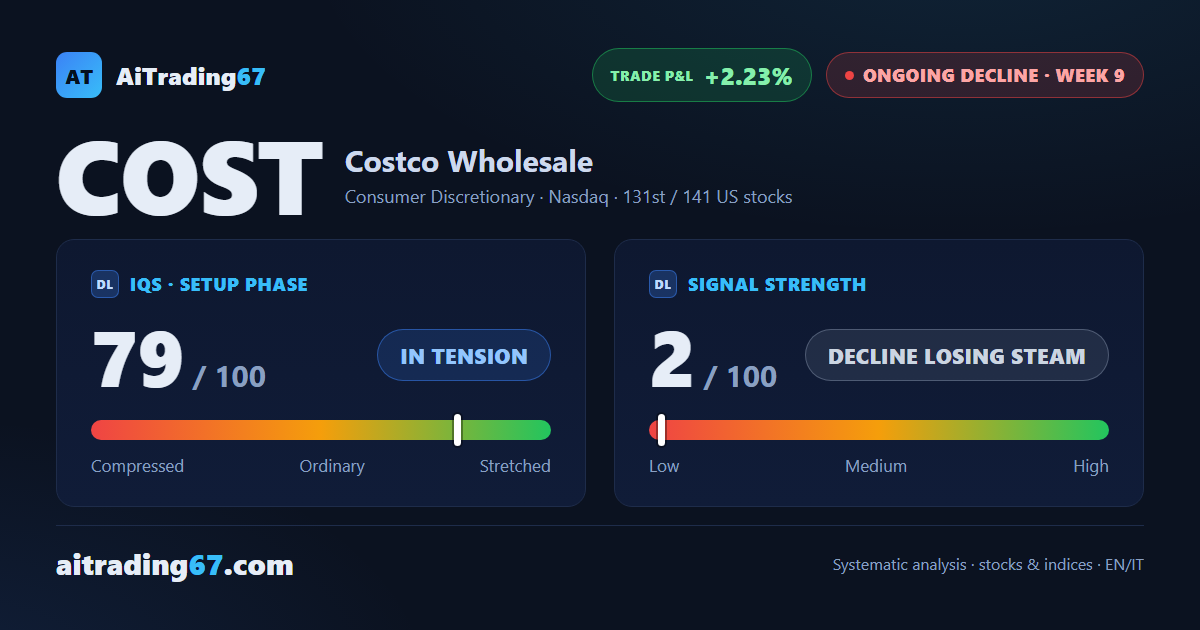
79
in tension
Signal Strength
2
decline losing steam
Sizing
MINIMUM
Ranking
#131 / 141
US stocks
Trade P&L %
+2.23%
from signal to today
Rank position
ranks 131st among the 141 sell signals for US stocks in our ranking, with a signal strength of 2 out of 100.
Sector context
SectorConsumer Discretionary
Benchmark ETFXLY
Sector regimeweak phase
Performanceweekly -5.22% · monthly -4.92%
COST belongs to the consumer discretionary sector (reference ETF XLY). The sector is classified weak phase according to our weekly reading.
restricted Platinum content