
Compass Group: double bottom, buyers in control
Compass Group slips 1.4% as the double bottom keeps buyers in control
Compass Group: double bottom, buyers in control
Our view last week
Compass Group is in week 10 of a buy signal, up 8.76% since entry. All 3 targets from our most advanced model were hit in prior weeks, and the management discipline now reaches its third and final time-based window: a suggested 30% trim. Signal strength remains medium-weak, with a technical picture calling for caution rather than conviction.
This week's summary
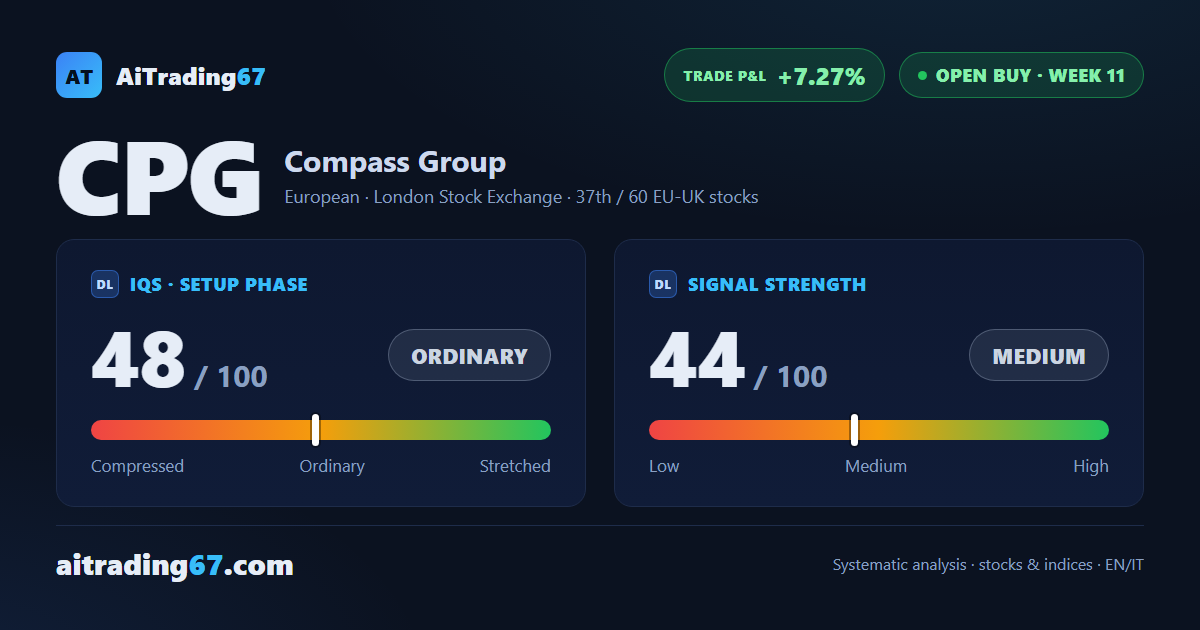
This week Compass Group shares fell 1.4%, but the daily chart tells a different story: a clean double bottom in the 31 area, a 14% intermediate rebound, and 85% of the buy volume dominating the session. The stock is still hugging its all-time highs, a level already tested twice, confirming the same caution seen last week. Compass Group's technical analysis shows a buy signal in its 11th week, up 7.27%.
IQS Phase
48
ordinary
Signal Strength
44
medium · weak
Sizing
REDUCED
Ranking
#37 / 60
EU-UK stocks in progress
Trade P&L %
+7.27%
from signal to today
restricted Platinum content