
Campari: the decline slows, RSI climbing
Campari gains 1.3% and stays boxed between two tight technical walls
Campari: the decline slows, RSI climbing
Our view last week
Davide Campari-Milano is in week 9 of a sell signal, and the picture over the past few weeks has turned more mixed: a double bottom has formed on the daily chart in the 5.3 area, with an intermediate rebound of 7%. Buying volume has swung firmly back into the lead, at 83%, though the weekly structure remains intermediate bearish.
This week's summary
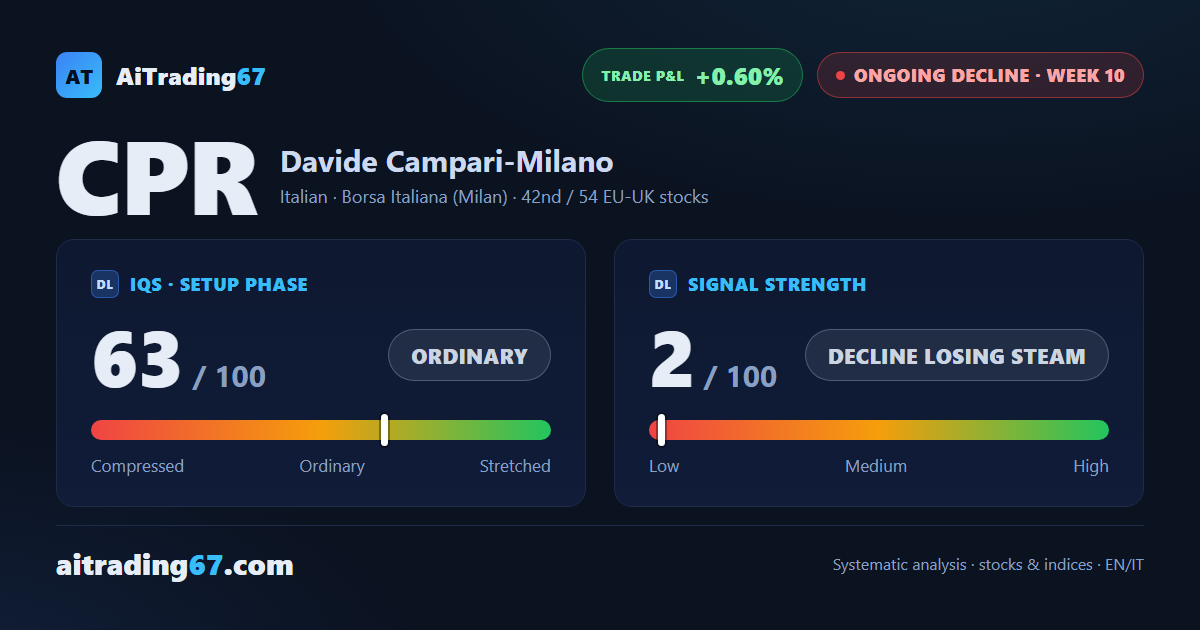
Campari shares are boxed into a very tight band, between the daily pivot support in the 5.56 area and the daily upper Bollinger Band resistance in the 5.61 area. After the double bottom two weeks ago, buying pace has cooled: from last week's 83% down to a more balanced 53%. The weekly RSI keeps climbing though, up to 44, while weekly money flow stays negative — the picture reads as a decline that has lost its fresh push, not yet an inversion.
IQS Phase
63
ordinary
Signal Strength
2
decline losing steam
Sizing
MINIMUM
Ranking
#42 / 54
EU-UK stocks
Trade P&L %
+0.60%
from signal to today
restricted Platinum content