
AXA near highs, but the buy signal is fading
AXA gains 1.2% near record highs as its buy signal starts to fade
AXA near highs, but the buy signal is fading
Our view last week
AXA shares closed the week up 1.3%, with the weekly structure still intact and the ADX climbing: the trend is gaining conviction. In this week's technical analysis, though, price is working a step from its all-time highs, a level already tested twice in the past ten weeks, with volume in light contraction beneath the surface. The buy signal stays valid: the confirmation week calls for managing with discipline, waiting for a pullback before adding weight.
This week's summary
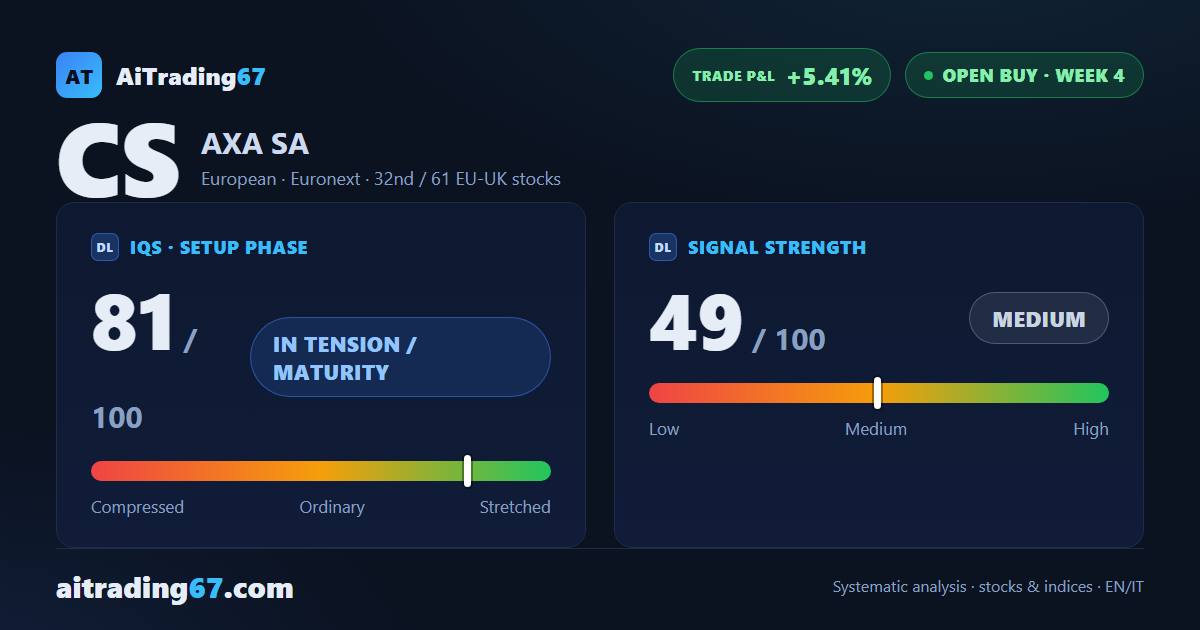
AXA shares add 1.2% and stay just under their all-time highs, a level already tested twice in the past ten weeks. In this week's technical analysis the trend is still gaining traction — the moving averages are aligned and the ADX is climbing — but the buy signal is starting to fade and volume is thinning out. The stop is already at breakeven: the 5.4% gain is locked in, while earnings on July 30 draw closer.
IQS Phase
81
in tension / maturity
Signal Strength
49
medium · weak
Sizing
REDUCED
Ranking
#32 / 61
EU-UK stocks in progress
Trade P&L %
+5.41%
from signal to today
restricted Platinum content