
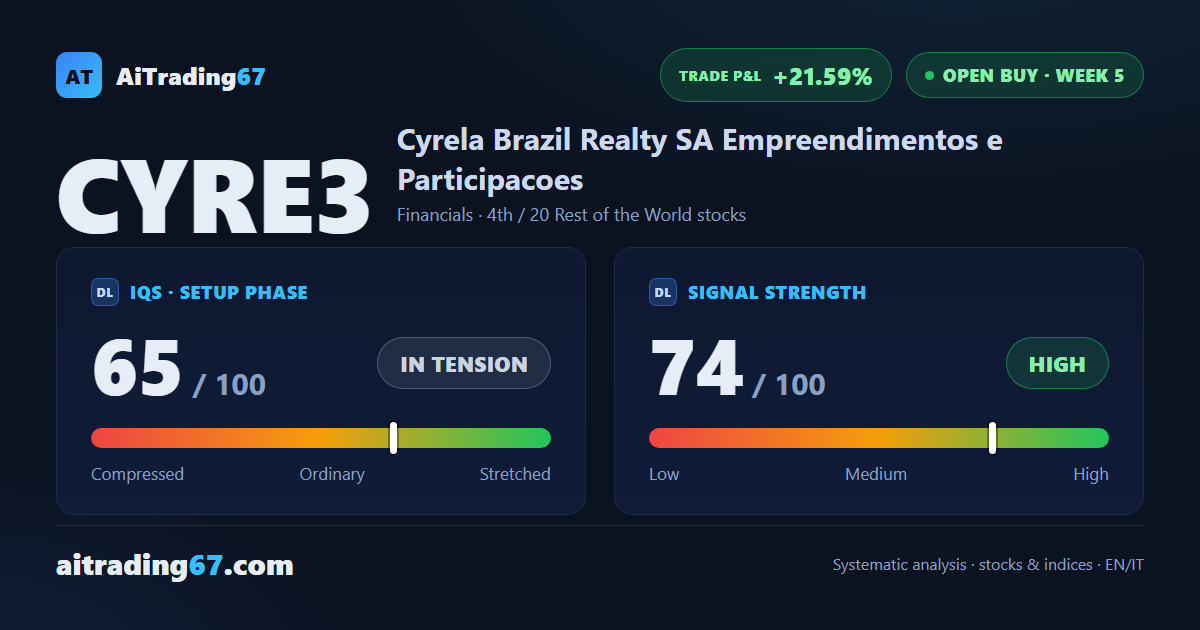
Open buy · week 5 · Brazil
Cyrela gains 3.7% and prints a new 90-day high on a run of 6 higher lows
Our view last week
The daily price action stretches the run of higher lows to 5, from the 25 area to the 26 area: Cyrela stock closes the week up 1.2% and the trade climbs to 17.3%. The push stalls, though, below the upper daily Bollinger Band in the 27.9 area, and the break of recent highs, already awaited a week ago, has yet to come. In weekly technical analysis terms the MACD keeps improving, while for the first time in 3 weeks volume tilts to the sellers: a swing trading setup to watch.
This week's summary
The break of the highs that was still missing a week ago came halfway: Cyrela gains 3.7% and prints a new 90-day high, in the 28.3 area, closing above the previous one but not yet above the one just made. Cyrela stock stretches its run of daily higher lows to 6, with the weekly MACD improving and money flow positive and rising. In weekly technical analysis terms the trade climbs to +21.6%: a swing trading setup with bullish price action and a few warning signs.
IQS Phase
65
in tension
Signal Strength
74
high · wide move
Sizing
FULL
Ranking
#4 / 20
Rest of the World stocks in progress
Trade P&L %
+21.59%
from signal to date, no stop loss
Cyrela (CYRE3) weekly chart — EMA50 · MACD · VWAP
Weekly chart · EMA50 · MACD · VWAP · Source: TradingView
Rank position
ranks 4th among the 20 Longs already running for titoli resto del mondo in our ranking, with a signal strength of 74 out of 100.
Sector context
SectorFinancials
Benchmark ETFXLF
Sector regimeweak phase
Performanceweekly -2.46% · monthly -7.23%
CYRE3 belongs to the financials sector (reference ETF XLF). The sector is classified weak phase according to our weekly reading.
restricted Platinum content