
Sell signal, week 13: the short moves to +21.5%
D-Wave Quantum drops 9.4% and closes below its previous 90-day low
Our view last week
D-Wave Quantum stock posts a third straight up week, +1.8%, yet the tape swings back to the sellers: 62% of weekly volume goes to the sell side, after a week in buyers' hands. The price action still reads as distribution, with an indecisive weekly candle, and price stalls under the 20-day average. Among US tech stocks the sell signal stays under management, the short 13.3% in profit, in a decline losing conviction: the ADX has been falling for 14 weeks.
This week's summary
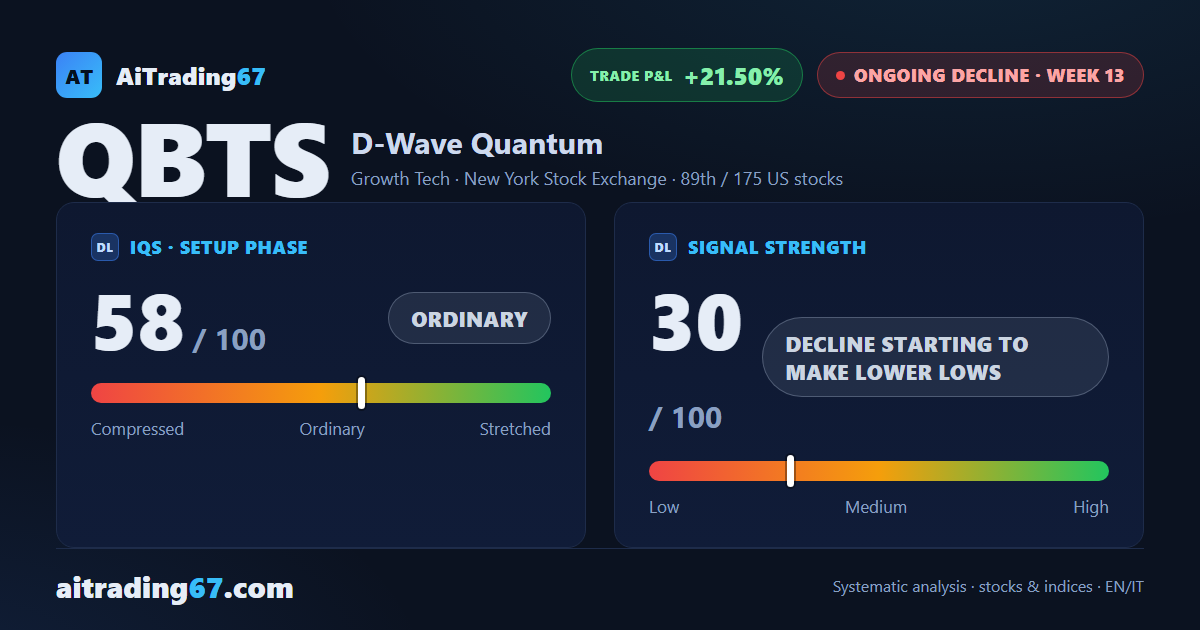
D-Wave Quantum drops 9.4% and wipes out a 3-week rebound: the week closes below its previous 90-day low and back under the 100-week moving average, in the 17 area. A week ago D-Wave Quantum stock had stalled beneath its 20-day average, and that is where the decline resumed. The weekly price action still reads as distribution, with contracting volumes and the MACD below its Signal line for 12 weeks. Among US tech stocks the sell signal stays under management, the short 21.5% in profit.
IQS Phase
58
ordinary
Signal Strength
30
decline starting to make lower lows
Sizing
REDUCED
Ranking
#89 / 175
US stocks
Trade P&L %
+21.50%
from signal to date, no stop loss
D-Wave Quantum (QBTS) weekly chart — EMA50 · MACD · VWAP
Weekly chart · EMA50 · MACD · VWAP · Source: TradingView
Rank position
ranks 89th among the 175 sell signals for US stocks in our ranking, with a signal strength of 30 out of 100.
Sector context
SectorGrowth Tech
Benchmark ETFXLK
Sector regimein strong phase
Performanceweekly +1.80% · monthly +8.83%
QBTS belongs to the growth tech sector (reference ETF XLK). The sector is classified in strong phase according to our weekly reading.
restricted Platinum content