
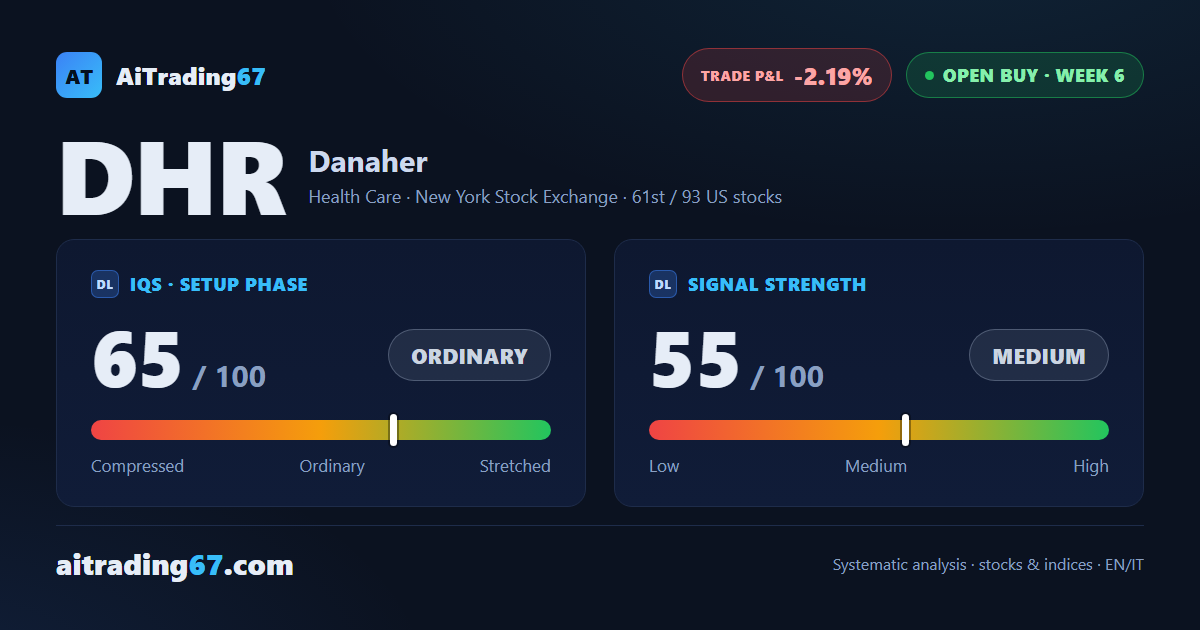
Open BUY · week 6 · US stocks
Danaher drops 4.6% after a new 30-week high that the weekly close failed to confirm
Our view last week
Danaher gains 6% and clears the 212 area, where the 200-week average runs and where the stock was still capped a week ago. On the daily chart, price action traces 3 higher lows between Sep 14 and Sep 24, from 199 to 219, with 87.6% of the last session's volume on the buy side. For Danaher stock the buy signal swings from -3.2% to +2.6% since entry, and price is now working just under its recent highs.
This week's summary
Danaher printed a new 30-week high, in the 228 area, and the weekly close did not confirm it: the week ends 4.6% lower and gives back most of last week's 6% gain. Danaher stock is back on its 200-week average, in the 212 area, reclaimed only a week ago and holding for now. Price action still describes a weak uptrend, with the ADX falling for 10 weeks. Price closed below the breakeven stop flagged in last week's card (218.85 area): for anyone following that level the trade is closed.
IQS Phase
65
ordinary
Signal Strength
55
medium
Sizing
STANDARD
Ranking
#61 / 93
US stocks in progress
Trade P&L %
-2.19%
from signal to date, no stop loss
Danaher (DHR) weekly chart — EMA50 · MACD · VWAP
Weekly chart · EMA50 · MACD · VWAP · Source: TradingView
Rank position
ranks 61st among the 93 Longs already running for US stocks in our ranking, with a signal strength of 55 out of 100.
Sector context
SectorHealth Care
Benchmark ETFXLV
Sector regimein positive regime
Performanceweekly -2.65% · monthly -3.91%
DHR belongs to the health care sector (reference ETF XLV). The sector is classified in positive regime according to our weekly reading.
restricted Platinum content