
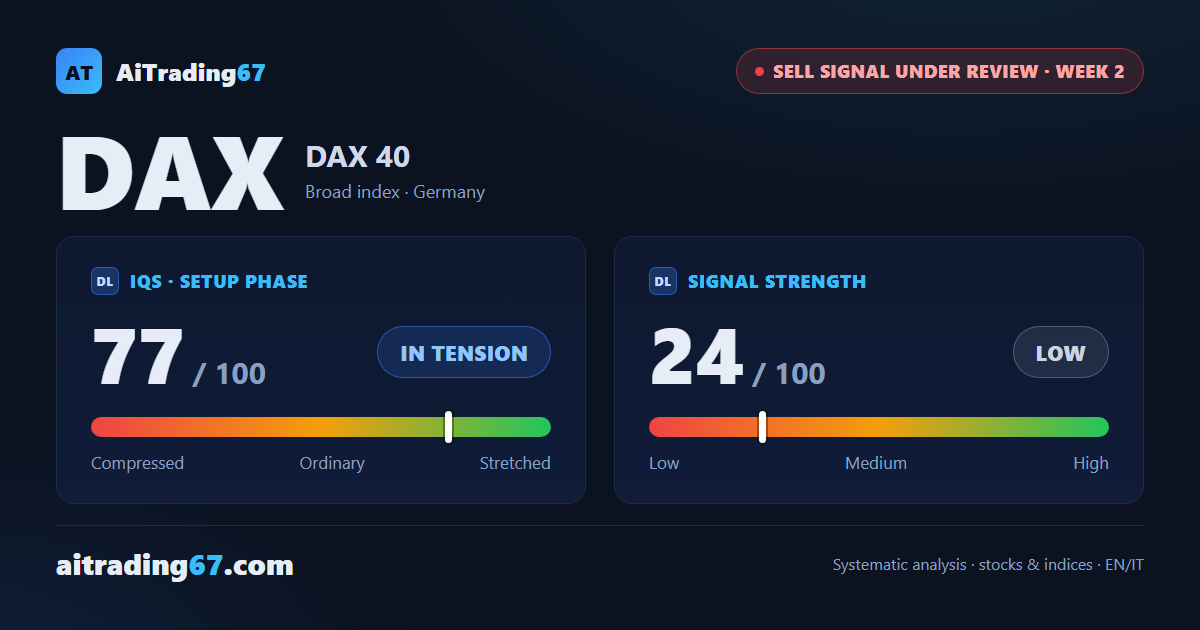
DAX · Sell signal under review, week 2 of 3
DAX: new 30-day low not confirmed on the close, the 200-day average holds
Our view last week
The DAX ETF, tracking Germany's DAX 40, ends the 1st week after its sell signal slightly higher, 0.35% above the signal price, and edges back a whisker above the 20-week average. The bounce stalls in the 233 area, though, where the short-term averages keep pushing it back, and the daily chart prints a 3rd lower high. The decline carries little strength and sellers have led volume for 4 weeks. For price action trading, this is a trade setup to wait on, between the month's lows and that lid.
This week's summary
The DAX ETF, tracking Germany's DAX 40, is in week 2 after its sell signal: it printed a new 30-day low in the 226 area, dipped to the 200-day average and closed back above, in the upper half of the weekly range. A week ago it had edged above the 20-week average; it has now lost it again. Technical analysis and price action trading both describe a trade setup on hold, between that low and the short-term averages capping price in the 232-233 area.
IQS Phase
77
in tension
Signal Strength
24
low · fading
ATH distance
5.42%
5.42%
KPI 4
0/3
restricted Platinum content