
Deutsche Bank, a breather after the weekly rally
Deutsche Bank slips 1.5% after its rally, but the technical picture holds firm
Deutsche Bank, a breather after the weekly rally
Our view last week
Deutsche Bank is in week 11 of an open buy signal, with the model's coverage completed: all 3 reference targets already hit and the trade up 10.10% since entry. The setup quality indicator sits at 75 out of 100, still in tension, while signal strength has eased to 44 out of 100. The stop is now dynamic and tightening week by week.
This week's summary
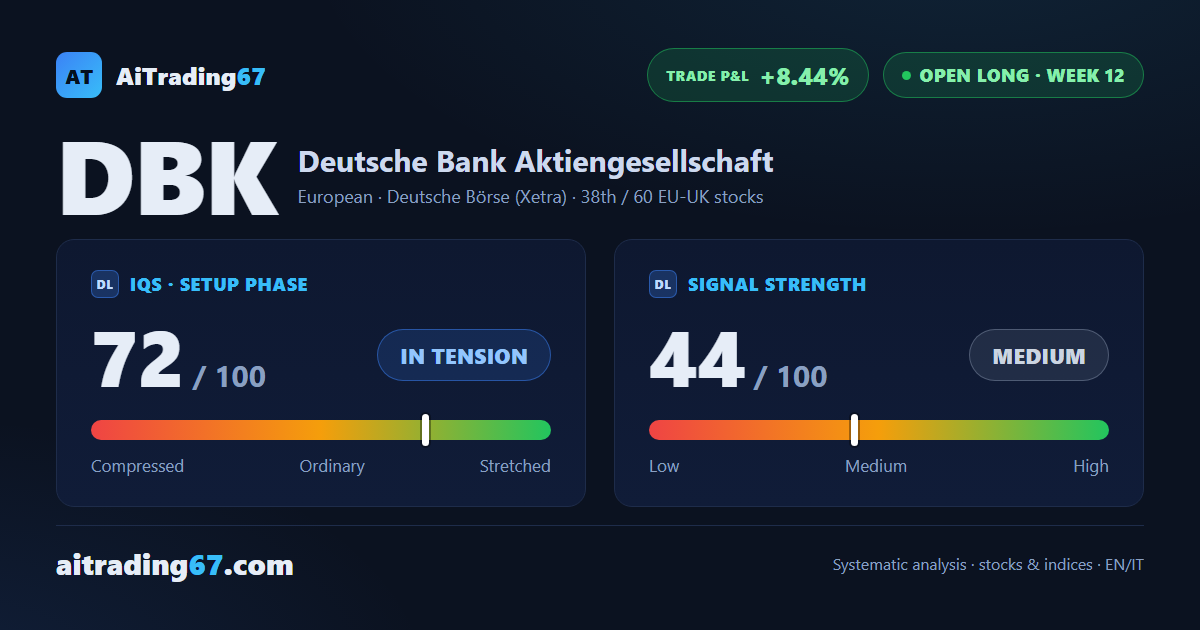
Deutsche Bank cools off with a 1.5% pullback after last week's rally, sellers briefly taking charge of the daily volume. Under the hood the picture stays solid: the MACD keeps improving, money flow holds positive, and price is finding support below the 32.4 area resistance, already rejected three times: every sign of a rally simply catching its breath. Versus last week's +10.10%, the trade's gain has eased to +8.44%.
IQS Phase
72
in tension
Signal Strength
44
medium · weak
Sizing
REDUCED
Ranking
#38 / 60
EU-UK stocks in progress
Trade P&L %
+8.44%
from signal to today
restricted Platinum content